Kansas Geological Survey, Current Research in Earth Sciences, Bulletin 258, part 3
Prev Page--Results || Next Page--Conclusions and References
![]()
![]()
![]()
Kansas Geological Survey, Current Research in Earth Sciences, Bulletin 258, part 3
Prev Page--Results ||
Next Page--Conclusions and References
![]()
The vertical variation in water quality in any well within the transition zone ultimately depends on the amount of mixing that has occurred over long periods between the inflowing low TDS freshwater from recharge areas in southwest Missouri and the resident sodium-chloride brines to the west in the Cherokee basin (Macfarlane and Hathaway, 1987). The plots in figs. 11-15 for the Pittsburg well 8 pumping tests imply that waters of differing quality are contributed from different parts of the aquifer at different rates to the well during pumping. Changes in the constituent concentrations as pumping progressed during the tests indicate that the amounts contributed from each source within the aquifer change with time. In particular, the excellent fit of the data points from both tests with the mixing curve on a bicarbonate to chloride ratio versus chloride plot clearly indicates changes in the mixing of water from fresh and more saline end-members within the open borehole of the well.
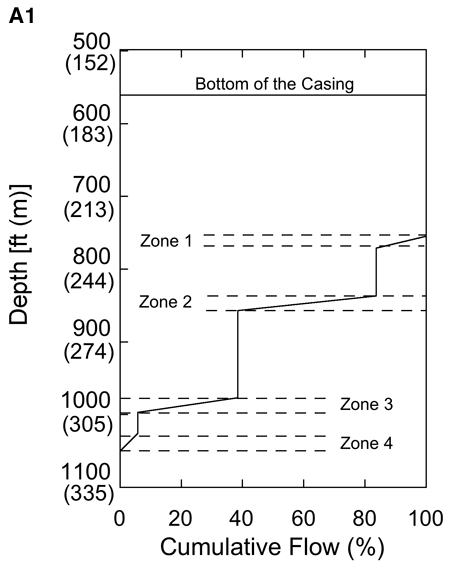
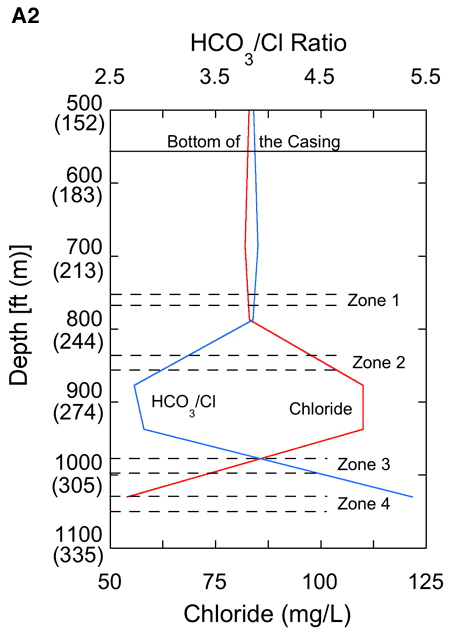
This interpretation is supported by U.S. Geological Survey data from August 2007 flowmeter measurements and sampling of produced water collected at various depths within the open borehole section from the Pittsburg well 10 after it had been pumped for one week (figs. 1, 22A1, 22A2; Pope et al., 2009). The depth and construction of well 8 are nearly identical to those of well 10, which is located approximately 1,400 ft (427 m) to the south. The pump in well 10 is situated in the cased portion of the borehole, 350 ft (107 m) below the well top. A well-bore flowmeter survey of Pittsburg well 10 revealed that 77% of the flow into the open borehole was contributed by two thin zones from 837 ft to 857 ft (255 m to 261 m) in the lower part of the Roubidoux Formation (Zone 2) and from 977 ft to 997 ft (298 m to 304 m) in the middle of the Gasconade Dolomite (Zone 3; fig. 22A1). More of the total flow came from Zone 2 (about 46%) than Zone 3 (about 31%). Because of the close proximity, similar construction, and depth of the wells, it is reasonable to conclude that the open borehole section of well 8 also penetrates Zones 1 through 4. Chloride concentration and the bicarbonate to chloride ratio for six water samples collected within the borehole from 487 to 1,030 ft below the top of well 10 after a week of pumping ranged from 54 mg/L to 110 mg/L and 2.73 to 5.37, respectively (fig. 22A2).
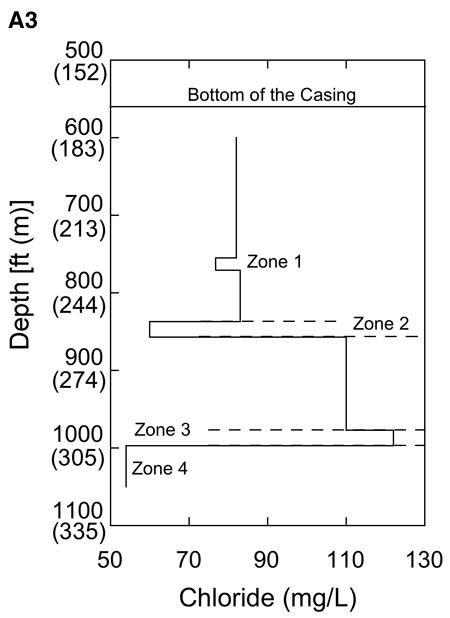
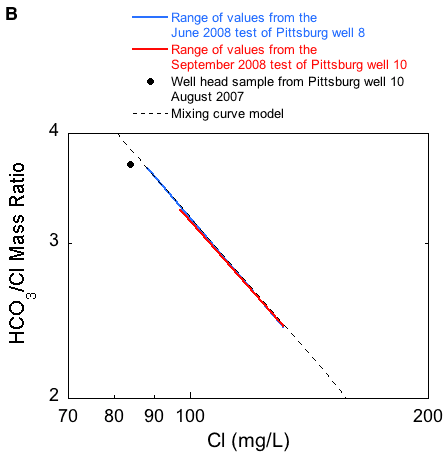
Figure 22--(A) Cumulative flow (A1), chloride concentration and bicarbonate to chloride ratio (A2), and calculated zonal chloride concentration (A3) versus depth in Pittsburg well 10; and (B) chloride concentration and bicarbonate to chloride ratio range for samples from the June and September 2008 pumping tests of Pittsburg well 8 in comparison to the wellhead sample collected from Pittsburg well 10. All samples were collected after one week of continuous pumping. Pittsburg well 10 data are from Pope et al. (2009).


The chloride concentration entering from each of the four zones in the open borehole of well 10 was estimated using a rearranged form of equation 1, the flowmeter data (fig. 22A1), and chloride concentrations of water sampled from various levels within the well (fig. 22A2). In the calculation, it is assumed that the flow entering the open borehole from each of the zones moves upward toward the pump and mixes with water below the zone. Equation 1 can be expressed as
C1f1 + C2f2 = C3(f1 + f2), (2)
where f1 is the fractional amount of water in relation to the total at the top of the zone with a chloride concentration of C1 that is moving upward from below the zone in question, f2 is the fractional amount of water in relation to the total at the top of the zone with a chloride concentration of C2 that is moving into the well from the zone, and C3 is the concentration of the mix at the top of the zone. With two end-member mixing, f1 + f2 are equal to 1 andf2 = 1- f1. (3)
Substitution of equation 3 into equation 2 and solving for C2 produces
C2 = (C3 - C1 f1)/(1- f1). (4)
The profile in fig. 22A3 combines the calculated chloride concentrations of water entering the well in each zone with the chloride concentrations of the samples collected between the zones. The calculation was performed starting at the top of zone 3 and moving upward. The plot shows that the chloride concentration does not change monotonically with depth from zone to zone but rather decreases from 77 mg/L to 60 mg/L from Zone 1 to Zone 2, increases from 60 mg/L to 122 mg/L from Zone 2 to Zone 3, and decreases from 122 mg/L to 54 mg/L from Zone 3 to Zone 4. These changes occur over a vertical interval of about 300 ft (91 m) in the upper part of the Ozark aquifer. The lowest chloride concentration and highest bicarbonate to chloride ratio occurred in water collected near the bottom of the well, indicating that saline water is not entering the deepest zone of the well at the well location. However, it is important to note that for the most productive zones, Zone 2 produced lower chloride water than Zone 3.
The well-head sample collected after a week of pumping Pittsburg well 10 plots close to the mixing curve in fig. 22B and follows the trend of decreasing chloride concentration and increasing bicarbonate to chloride ratio with increasing length of the pumping period established in the June and September 2008 pumping tests of Pittsburg well 8 (figs. 11 and 13). The close overlap of the range of data for Pittsburg wells 8 and 10 shown on fig. 22B suggests that the temporal changes in the chloride concentration and bicarbonate to chloride ratio observed in both well 8 tests could have resulted from changes in the relative volumes of water contributed to the well by different zones over time. Changes in the quality of water produced from different depth zones over time, as well as a combination of both processes could also be explanations. It is unclear which of these scenarios accounts for the general decrease in the chloride concentration of the water produced at the wellhead (fig. 11). The substantially different water quality and flow rate for different depth zones in the aquifer suggest that some of the variability in the chloride and bicarbonate concentrations occurring during both pumping tests could have resulted from small variations in the pumping rate.
After a week of pumping well 10, more of the flow entering the open borehole came from Roubidoux Formation sandstones in Zone 2 than from the equally thick Zone 3 in the dolostones of the Gasconade dolomite (fig. 22A1). This difference in flow rates suggests that the transmissivity of Zone 2 is higher than that of Zone 3. Most of the flow from Zone 3 is from secondary permeability features within the Gasconade Dolomite. Data are not available from well 10 to assess the degree of vertical fracturing or carbonate rock dissolution in this interval of the well. However, the Pittsburg well field is located near the crest of the Pittsburg anticline (fig. 3) and fracture sets developed on and parallel to the crest of the structure would be extensional in origin, presumably with wider apertures than sets developed on the flanks or in the adjacent synclines. The higher chloride concentration in water discharging from Zone 3 suggests that these more open fractures could tap sources of higher chloride water that could exist in the lower part of the Ozark and St. Francois aquifers. However, vertical profiles of hydraulic head in the open borehole section of well 10 were not collected prior to and following pumping to lend support for this hypothesis.
Drawdown from individual pumping events could induce 1) lateral flow of lower chloride water through the Roubidoux Formation sandstones from the shallow part of the aquifer and 2) upward flow of higher chloride water from deeper transmissive intervals within the Gasconade Dolomite into the well and the adjacent sandstones. The June test was conducted prior to the annual period of high pumping stress, and hydraulic head in the aquifer was higher in the well field (fig. 5) and presumably in both Zones 2 and 3. Prior to this test, the hydraulic head in Zone 3 could have been higher than in Zone 2, which would have allowed higher chloride water to move into this upper zone. When the pump for well 8 was turned on, water from all of the zones would start to flow into the well. In the early part of the pumping period, the higher chloride water from Zone 3 and the part of Zone 2 affected by Zone 3 water would have entered the well resulting in the observed higher chloride concentration (fig. 11). Continued pumping would have gradually flushed the higher chloride water from Zone 2, resulting in a gradual decline in the chloride concentration with time. Turning off the well could potentially have allowed water from deeper zones to continue to flow slowly upwards into the well from Zone 3 into Zone 2 during recovery. Prior to the September well 8 pumping test, higher pumping stress lowered the hydraulic head in the Ozark aquifer in the Pittsburg area generally as indicated by the lower water levels in the monitoring well (fig. 5). This could have increased the vertical hydraulic head gradients within the Ozark aquifer and consequently, the potential for upward flow from deeper flow zones during pumping. The early drawdown in the September well 8 test could have initially induced more flow into the well from Zone 2 than from Zone 3 causing the chloride in the produced water in the early part of the pumping period to decrease (fig. 11). As pumping progressed, the flow from Zone 2 could have slowed sufficiently relative to Zone 3 because of further increases in the vertical hydraulic head gradient so that the continued decline in the chloride concentration of the produced water over time would have eventually ceased (fig. 11). Alternatively, vertical head gradients could have induced leakage of water from Zone 3 to Zone 2 within the aquifer resulting in a decreasing rate of decline in the chloride concentration.
Long-term change in the quality of produced water is occurring very slowly and over many cycles of pumping and recovery and high and low stress periods at Pittsburg well 10 and Crawford Consolidated RWD 1 well 2 as indicated by the datasets from this project, the 1979-1980 sampling events, and from Darr (1978). Because of the limited sampling that was done in 1979-1980, the amount of change in the bicarbonate and chloride concentrations over the last 25 years is difficult to gauge (fig. 18). However, if the variability in the monthly data from Pittsburg well 8 is similar to that of Pittsburg 10, the apparent change in produced water quality from Pittsburg well 10 from 1979-1980 to 2006-08 is much greater than the monthly variability (fig. 16). The chloride concentration versus bicarbonate/chloride mixing plot in fig. 16 shows that the long-term change in quality of the produced water from Pittsburg well 8 follows the mixing curve from lower chloride to higher chloride values. Assuming that the water quality in Pittsburg well 10 has evolved over time in a manner similar to that of Pittsburg well 8, then the general decrease in chloride concentration and an increase in the bicarbonate/chloride ratio during both pumping tests appears opposite to the long-term trend. Higher levels of pumping during certain times of the year cause a general lowering of the hydraulic head within the Ozark aquifer and the Pittsburg area wells to produce higher chloride water after extended pumping such as indicated by fig. 18.
Upward migration of saline water from the lower part of the Ozark and St. Francois aquifers is a much simpler explanation of the increased salinity in the Pittsburg area wells than eastward migration of more saline water into the area. The observed decrease in the chloride concentration with extended pumping in the well 8 pumping tests is difficult to explain if it is assumed that saline water is moving into the area from the west. In that scenario, the chloride concentration in the produced water during a single pumping period should be relatively constant or possibly increase with time. However, data are currently lacking to evaluate the potential for upward movement of more saline water into the upper part of the Ozark aquifer from deeper zones.
Macfarlane and Hathaway (1987) and Imes and Emmett (1994) speculated that downward leakage from the Springfield Plateau aquifer was a major source of recharge to the Ozark aquifer in the Tri-state region. This is not evident in the results of the Pittsburg 8 chemical-quality pumping tests (figs. 14-15). Ground waters from the Springfield Plateau aquifer in southeast Kansas are a sodium-bicarbonate type (Macfarlane and Hathaway, 1987). A Springfield Plateau aquifer well located 1 mi (1.3 km) northeast of Pittsburg 8 was sampled twice in 1979-1980. The average excess sodium + potassium and bicarbonate ratios from the two samplings are 15.3 and 21.7, respectively. In the June pumping test, the excess sodium + potassium ratio rose to approximately 1.5 with some fluctuation throughout the pumping period. In the September test, the ratio rose early and then remained relatively constant at approximately 1.35 throughout the remainder of the pumping period. In both tests, the excess bicarbonate ratio remained relatively constant with values below 1.25. The low excess bicarbonate and sodium + potassium ratios from the June and September tests suggest that pumping-induced recharge from leakage is either negligible or, if small, is masked by cation exchange and carbonate equilibria that alter the water chemistry.
The chloride concentration for the three monthly samples collected from Pittsburg well 10 during 2006 to 2007 ranged from 88.9 to 109 mg/L. The chloride concentration range for three samples obtained from the same well during 1979-1980 was 38-41 mg/L. If the minimum and maximum differences in chloride concentration between the two sampling periods are divided by the time between the periods, the rate of chloride increase ranges from 1.8 to 2.6 mg/L/yr. The minimum and maximum chloride concentrations observed for the two pumping tests of Pittsburg well 8 during 2008 were 88.2 and 132 mg/L, respectively. If the chloride content of Pittsburg well 8 during 1979-1980 was about the same as for Pittsburg well 10 (around 40 mg/L), then the rate of chloride increase for Pittsburg well 8 ranges from 1.7 to 3.2 mg/L/yr. Based on the value and the date of the maximum chloride concentration observed for each of the two wells and the maximum rate of chloride increase, and assuming that the increase rate remains linear with time, the chloride level would not exceed the recommended drinking water limit of 250 mg/L until approximately 37 years (the year 2045) for Pittsburg well 8 and 54 years (the year 2060) for Pittsburg well 10.
The range in increase rate estimates indicate that the data from the monthly sampling and pumping tests of Pittsburg well 8 have important ramifications for designing a water-quality monitoring protocol to determine long-term changes in water quality. For this well, the greater ranges of chloride concentration for the pumping test samples than for the monthly samples underscores the need to factor short-term variability in produced water chemistry into the frequency of sampling, the timing of sampling relative to pump start-up and possibly to seasonal water use, and the analysis of the resulting data for trend. The monthly sampling results for many of the other wells sampled in this project exhibit trends indicating changes in the relative proportions of the cations, anions, or both (fig. 6). Longer-term pumping tests of these other wells could reveal results similar to those found for Pittsburg well 8.
Prev Page--Results || Next Page--Conclusions and References
Kansas Geological Survey
Placed online June 25, 2010
http://www.kgs.ku.edu/Current/2010/Macfarlane/05_disc.html
email:webadmin@kgs.ku.edu