Prev Page--Ground water Occurrence, Recover, Utilization || Next Page--Formations
Ground Water, continued
Hydrologic Properties of Water-bearing Materials
The quantity of water that a water-bearing formation will yield to wells depends upon the hydrologic properties of the material penetrated by the wells. The hydrologic properties of greatest significance are the coefficients of transmissibility (T) and storage (S). These factors are used in making estimates of the quantity of water available in an aquifer and of the water-level decline that will result from continued pumping. Controlled aquifer tests in the field can provide the data needed to compute these coefficients.
The coefficient of transmissibility (T) may be defined as the number of gallons of water, at the prevailing temperature, that will move in 1 day through a vertical strip of the aquifer 1 foot wide, having a height equal to the full saturated thickness of the aquifer, under a hydraulic gradient of 100 percent or 1 foot per foot.
The coefficient of storage (S) of an aquifer is the change in its stored volume of water per unit change in head per unit surface area of the aquifer. Under water-table conditions the coefficient of storage (S) is equal to the specific yield of the aquifer.
Aquifer Tests
Several aquifer tests have been made using wells in Harper County, but in only one test were observation wells used. The other tests were made by using measurements of the recovery of the water level in the wells after pumping stopped.
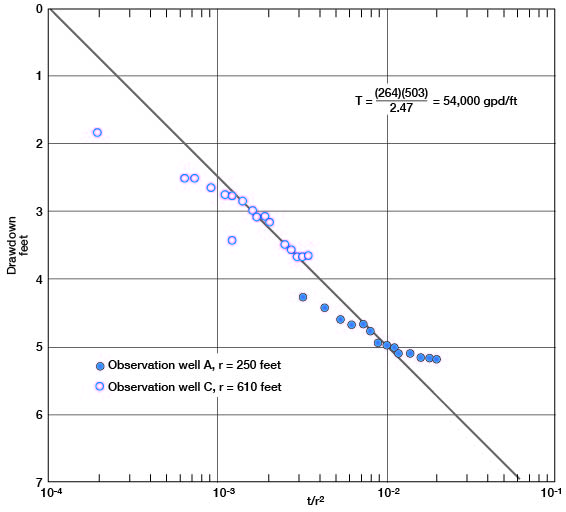
The test using observation wells was made October 16 and 17, 1953. The well pumped was 32-7-12cca2, owned by the city of Anthony in the East Sand Creek ground-water area. The test was made by the Pate Engineering Co. and Layne-Western Co. Two observation wells were installed for the test as follows: observation well A, 250 feet northeast of the pumped well, and observation well C, 610 feet southwest of the pumped well. The depth of the two observation wells and the pumped well was 99 feet. Well 32-7-12cca2 is a gravel-envelope well, drilled 38 inches in diameter, and cased with 18-inch pipe that has 20 feet of slotted screen at the bottom. The well was pumped for 23 hours and 40 minutes at a rate of 503 gpm. Depth-to-water measurements made in observation wells A and C during the test are given in Table 4, and depth-to-water measurements in the pumped well during the test are given in Table 5.
Table 4--Depth to water, drawdown, and values of t/r2 for observation wells A and C during aquifer test using well 32-7-12cca2.
| Time | Time since pumping started (minutes) |
Depth to water (feet) |
Drawdown (feet) |
Corrected drawdown (feet) |
t/r2 | |
|---|---|---|---|---|---|---|
| Obs. well A |
Obs. well C |
|||||
| 11:00 a.m. | 20 min. before pump started |
25.58 | 22.17 | 0 | 0 | 0 |
| 11:20 a.m. | pump started |
|||||
| 12:32 p.m. | 72 | 24.00 | 1.83 | 1.81 | 1.9 x 10⁻⁴ | |
| 12:38 | 78 | 29.00 | 3.42 | 3.36 | 1.2 x 10⁻³ | |
| 2:39 | 199 | 29.83 | 4.25 | 4.13 | 3.2 x 10⁻³ | |
| 3:15 | 235 | 24.67 | 2.50 | 2.46 | 6.3 x 10⁻⁴ | |
| 3:40 | 260 | 30.00 | 4.42 | 4.29 | 4.2 x 10⁻³ | |
| 3:52 | 272 | 24.67 | 2.50 | 2.46 | 7.3 x 10⁻⁴ | |
| 4:52 | 332 | 30.17 | 4.59 | 4.45 | 5.3 x 10⁻³ | |
| 5:00 | 340 | 24.83 | 2.66 | 2.61 | 9.1 x 10⁻⁴ | |
| 5:47 | 387 | 30.25 | 4.67 | 4.52 | 6.2 x 10⁻³ | |
| 6:00 | 400 | 24.92 | 2.75 | 2.70 | 1.1 x 10⁻³ | |
| 6:48 | 448 | 30.25 | 4.67 | 4.52 | 7.2 x 10⁻³ | |
| 7:00 | 460 | 24.92 | 2.75 | 2.70 | 1.2 x 10⁻³ | |
| 7:59 | 519 | 30.33 | 4.75 | 4.60 | 8.3 x 10⁻³ | |
| 8:00 | 520 | 25.00 | 2.83 | 2.77 | 1.4 x 10⁻³ | |
| 8:50 | 570 | 30.50 | 4.92 | 4.76 | 9.1 x 10⁻³ | |
| 9:00 | 580 | 25.17 | 3.00 | 2.94 | 1.6 x 10⁻³ | |
| 9:46 | 626 | 30.58 | 5.00 | 4.83 | 1.0 x 10⁻² | |
| 9:58 | 638 | 25.25 | 3.08 | 3.02 | 1.7 x 10⁻³ | |
| 10:48 | 688 | 30.58 | 5.00 | 4.83 | 1.1 x 10⁻² | |
| 10:57 | 697 | 25.25 | 3.08 | 3.02 | 1.9 x 10⁻³ | |
| 11:45 | 745 | 30.67 | 5.09 | 4.92 | 1.2 x 10⁻² | |
| 11:55 | 755 | 25.33 | 3.16 | 3.08 | 2.0 x 10⁻³ | |
| 1:40 a.m. | 860 | 30.67 | 5.09 | 4.92 | 1.4 x 10⁻² | |
| 3:10 | 950 | 25.67 | 3.50 | 3.42 | 2.5 x 10⁻³ | |
| 4:00 | 1000 | 30.75 | 5.17 | 4.99 | 1.6 x 10⁻² | |
| 4:10 | 1010 | 25.75 | 3.58 | 3.50 | 2.7 x 10⁻³ | |
| 5:45 | 1105 | 30.75 | 5.17 | 4.99 | 1.8 x 10⁻² | |
| 6:05 | 1125 | 25.83 | 3.66 | 3.57 | 3.0 x 10⁻³ | |
| 6:42 | 1162 | 30.75 | 5.17 | 4.99 | 1.9 x 10⁻² | |
| 7:10 | 1190 | 25.83 | 3.66 | 3.57 | 3.2 x 10⁻³ | |
| 7:50 | 1230 | 30.75 | 5.17 | 4.99 | 2.0 x 10⁻² | |
| 8:08 | 1248 | 25.83 | 3.66 | 3.57 | 3.4 x 10⁻³ | |
Table 5--Depth to water and drawdown in well 32-7-12cca2 while pumping.
| Time | Time since pumping started (minutes) |
Depth to water (feet) |
Drawdown (feet) |
|---|---|---|---|
| 11:20 a.m. | 0 | 23.66 | 0 |
| 11:21 | 1 | 45.66 | 22.00 |
| 11:22 | 2 | 46.50 | 22.84 |
| 11:23 | 3 | 46.66 | 23.00 |
| 11:24 | 4 | 47.00 | 23.34 |
| 11:25 | 5 | 47.33 | 23.67 |
| 11:26 | 6 | 47.50 | 23.84 |
| 11:27 | 7 | 47.58 | 23.92 |
| 11:28 | 8 | 47.75 | 24.09 |
| 11:29 | 9 | 47.92 | 24.26 |
| 11:30 | 10 | 48.08 | 24.42 |
| 1:00 p.m. | 100 | 51.83 | 28.17 |
| 1:30 | 130 | 51.83 | 28.17 |
| 2:30 | 190 | 51.83 | 28.17 |
| 3:30 | 250 | 51.83 | 28.17 |
| 4:30 | 310 | 52.00 | 28.34 |
| 5:30 | 370 | 52.33 | 28.67 |
| 6:30 | 430 | 52.33 | 28.67 |
| 7:30 | 490 | 52.42 | 28.76 |
| 8:30 | 550 | 52.50 | 28.84 |
| 9:30 | 610 | 52.67 | 29.01 |
| 10:30 | 670 | 53.00 | 29.34 |
| 11:30 | 730 | 53.00 | 29.34 |
| 12:30 a.m. | 790 | 53.40 | 29.74 |
| 1:30 | 850 | 53.42 | 29.76 |
| 2:30 | 910 | 53.42 | 29.76 |
| 3:30 | 970 | 53.17 | 29.5! |
| 4:30 | 1,030 | 53.17 | 29.51 |
| 5:30 | 1,090 | 53.17 | 29.51 |
| 6:30 | 1,150 | 53.50 | 29.84 |
| 7:30 | 1,210 | 53.50 | 29.84 |
| 8:30 | 1,270 | 53.50 | 29.84 |
Cooper and Jacob (1946) devised three generalized graphical methods utilizing straight-line graphs for determining the coefficients of transmissibility and storage. The three types of graphs are referred to as the distance-drawdown graph, the time-drawdown graph, and the composite drawdown graph.
In Figure 11 the drawdowns in observation wells A and C are plotted against t/r2 on semilogarithmic paper. By application of the generalized composite drawdown formula:
T = 264Q/Δs in which
T = coefficient of transmissibility;
Q = discharge, in gallons a minute;
Δs = drawdown over one log cycle;
t = time since pumping started, in minutes; and
r = distance from pumped well, in feet; then
T = (264) (503) / 2.47 = 54,000 gpd/ft.
Figure 11--Generalized composite drawdown graph of water levels in observation wells A and C during aquifer test using well 32-7-12cca2.
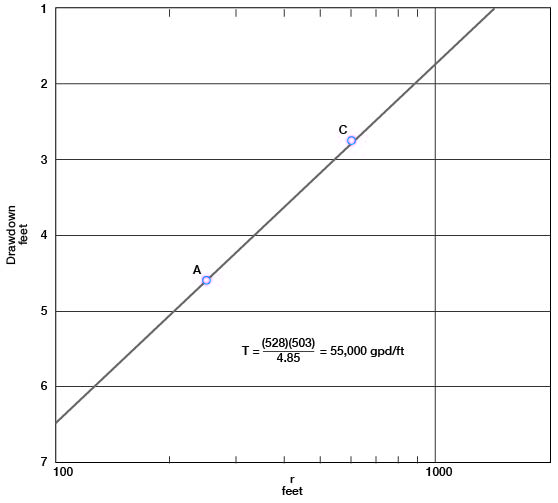
In Fig. 12 the corrected drawdowns in wells A and C, 520 minutes after pumping started, are plotted on semilogarithmic paper against distance from the pumped well. By application of the Cooper-Jacob generalized distance-drawdown formula T = 528Q / Δs, then
T = (528) (503) / 4.85 = 55,000 gpd/ft.
Figure 12--Generalized distance-drawdown graph of water levels in observation wells A and C, 520 minutes after pumping started.
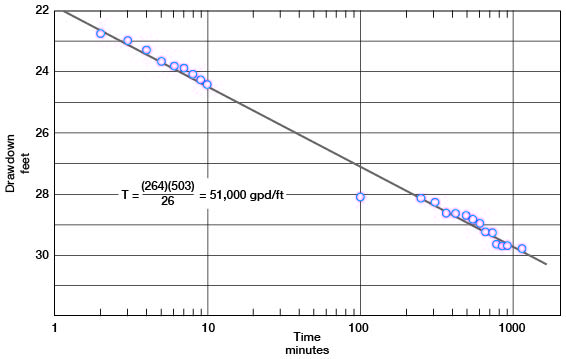
Drawdown in the pumped well is plotted on semilogarithmic paper against time since pumping started (Fig. 13). By application of the Cooper-Jacob generalized time-drawdown formula
T = 264Q / Δs then T = (264) (503) / 2.6 = 51,000 gpd/ft.
Because of the shortness of the test and the slow drainage of the aquifer, the coefficient of storage could not be determined.
Figure 13--Generalized time-drawdown graph of water level in well 32-7-12cca2.
The coefficient of transmissibility also was determined at well 32-6-4dcc, which also is in the East Sand Creek area. By measuring the recovery of the water level after pumping stopped, a value of 53,000 gpd per foot was obtained for the coefficient of transmissibility. A value of about 50,000 gpd per foot probably is near the true value for the water-bearing deposits in the East Sand Creek area.
Another aquifer test was made by the recovery method in well 31-7-18bac. The coefficient of transmissibility as determined by this test was 91,000 gpd per foot. This value may be considerably in error because measurements of the recovery of the water level were possible only in the well pumped. However, the well is located in the Upland area (Fig. 7), where generally the gravel is somewhat coarser than in the East Sand Creek area, and a higher value for the coefficient of transmissibility could be expected.
Chemical Character of Ground Water
The chemical character of the ground water in Harper County is shown by the analyses of 32 samples of water collected from wells and test holes (Table 6). Figures 14 and 15 show graphically the chemical character of typical water from the principal water-bearing formations in Harper County.
Table 6--Analyses of water from typical wells and test holes in Harper County. Analyst, H. A. Stoltenberg, Kansas Board of Health. Dissolved constituents given in parts per million. (One part per million is equivalent to one pound of substance per million pounds of water or 8.33 pounds per million gallons of water.)
| Well Number | Depth (feet) |
Geologic source | Date of collection |
Temp. (°F) |
Dissolved solids |
Silica (SiO2) |
Iron (Fe) |
Calcium (Ca) |
Magnesium (Mg) |
Sodium and potassium (Na+K) |
Bicarbonate (HCO3) |
Sulfate (SO4) |
Chloride (Cl) |
Fluoride (F) |
Nitrate (NO3) |
Hardness as CaCO3 | ||
|---|---|---|---|---|---|---|---|---|---|---|---|---|---|---|---|---|---|---|
| Total | Carbonate | Non- carbonate |
||||||||||||||||
| 31-5-10aaa | 32.0 | Slope deposits |
8-22-1956 | 56 | 386 | 12 | 1.3 | 48 | 16 | 74 | 305 | 33 | 32 | 0.2 | 21 | 186 | 186 | 0 |
| 31-5-25dcc | 60.0 | Permian | 8-22-1956 | 56 | 207 | 19 | .1 | 29 | 12 | 20 | 122 | 21 | 11 | .2 | 31 | 122 | 100 | 22 |
| 31-6-1cdd | 50.0 | Permian | 8-22-1956 | 56 | 597 | 23 | .06 | 74 | 37 | 79 | 328 | 185 | 25 | .2 | 13 | 336 | 269 | 67 |
| 31-6-5daa | 34.0 | Kansan and Nebraskan deposits |
4-24-1956 | 56 | 411 | 21 | .11 | 80 | 16 | 20 | 132 | 23 | 44 | .2 | 142 | 266 | 108 | 158 |
| 31-6-32aab | 45.0 | Permian | 8-22-1956 | 55 | 2,180 | 12 | .09 | 333 | 88 | 227 | 168 | 1,240 | 164 | .6 | 31 | 1,190 | 138 | 1,052 |
| 31-7-3cbb | 28.0 | Kansan and Nebraskan deposits |
8-27-1956 | 55 | 173 | 20 | .18 | 34 | 6.6 | 14 | 124 | 11 | 12 | .2 | 14 | 112 | 102 | 10 |
| 31-8-14cdd | 65.0 | Kansan and Nebraskan deposits |
4-25-1956 | 56 | 244 | 20 | .37 | 53 | 6.8 | 23 | 202 | 7 | 16 | .2 | 18 | 160 | 160 | 0 |
| 31-8-19aaa1 | 90.0 | Kansan and Nebraskan deposits |
10-27-1955 | 55 | 215 | .11 | 48 | 5.4 | 24 | 193 | 8.6 | 11 | .2 | 14 | 142 | 142 | 0 | |
| 3-9-16ddd | 80 | Kansan and Nebraskan deposits |
4-25-1956 | 56 | 285 | 21 | .11 | 64 | 4.5 | 34 | 264 | 10 | 14 | .1 | 7.1 | 178 | 178 | 0 |
| 32-5-13cbb | 56.0 | Permian | 8-22-1956 | 56 | 507 | 19 | .06 | 67 | 33 | 70 | 371 | 71 | 40 | .2 | 24 | 302 | 302 | 0 |
| 32-6-4dcc | 80.0 | Slope deposits |
4-24-1956 | 56 | 371 | 18 | .14 | 61 | 15 | 49 | 243 | 69 | 27 | .3 | 12 | 214 | 199 | 15 |
| 32-6-35daa | 26.5 | Permian | 4-24-1956 | 56 | 602 | 12 | .6 | 82 | 38 | 76 | 339 | 181 | 35 | .8 | 10 | 360 | 278 | 82 |
| 32-7-4dcc | 38.0 | Slope deposits |
8-27-1956 | 56 | 308 | 20 | .65 | 52 | 13 | 38 | 220 | 38 | 24 | .2 | 15 | 183 | 180 | 3 |
| 32-7-11add2 | 83.0 | Slope deposits |
7-27-1956 | 56 | 346 | .06 | 56 | 12 | 56 | 303 | 20 | 24 | .3 | 8.9 | 189 | 189 | 0 | |
| 32-7-12ccc1 | 93.0 | Slope deposits |
12-13-1954 | 56 | 465 | .05 | 77 | 15 | 77 | 373 | 61 | 30 | .4 | 9.3 | 254 | 254 | 0 | |
| 32-7-21ccc | 70 | Permian | 4-24-1956 | 57 | 3,600 | 11 | .15 | 499 | 116 | 478 | 120 | 2,070 | 356 | .9 | 1.8 | 1,720 | 98 | 1,622 |
| 32-8-4ddd | 40.0 | Permian | 8-22-1956 | 56 | 1,140 | 18 | .07 | 126 | 75 | 152 | 405 | 458 | 92 | 1.5 | 15 | 622 | 332 | 290 |
| 32-8-20bcd | 30 | Wisconsinan terrace deposits |
1-7-1944 | 56 | 420 | .15 | 98 | 19 | 40 | 112 | 248 | 38 | .3 | 6.6 | 322 | 92 | 230 | |
| 32-8-32aba | 20.0 | Kansan deposits |
4-25-1956 | 56 | 585 | 12 | .79 | 80 | 36 | 67 | 312 | 62 | 53 | .9 | 120 | 348 | 256 | 92 |
| 32-9-17ccd | 30 | Slope deposits |
4-25-1956 | 56 | 498 | 13 | .16 | 105 | 20 | 35 | 288 | 46 | 40 | .3 | 97 | 344 | 236 | 108 |
| 32-9-19ccb | 80.0 | Slope deposits |
9-12-1956 | 55 | 676 | 14 | .47 | 67 | 38 | 129 | 420 | 92 | 97 | .8 | 31 | 323 | 323 | 0 |
| 33-5-4ddd | 40.0 | Permian | 8-22-1956 | 57 | 770 | 13 | 2.0 | 72 | 57 | 124 | 276 | 25 | 251 | .4 | 93 | 414 | 226 | 188 |
| 33-5-30ddd | 69.0 | Permian | 8-23-1956 | 55 | 485 | 16 | .11 | 48 | 21 | 107 | 388 | 47 | 44 | .2 | 11 | 206 | 206 | 0 |
| 33-7-34ccd2 | 40 | Wisconsinan terrace deposits |
8-21-1941 | 56 | 730 | .05 | 73 | 18 | 50 | 235 | 107 | 41 | .3 | 3.2 | 256 | 193 | 63 | |
| 33-8-13ddd | 41.0 | Permian | 4-25-1956 | 56 | 677 | 24 | .9 | 113 | 45 | 52 | 351 | 36 | 109 | .6 | 124 | 467 | 288 | 179 |
| 33-9-5baa | 25 | Slope deposits |
4-25-1956 | 55 | 419 | 18 | .13 | 62 | 19 | 65 | 281 | 50 | 61 | .5 | 5.3 | 232 | 230 | 2 |
| 34-5-29bbb | 35.0 | Permian | 4-24-1956 | 55 | 398 | 13 | 43 | 30 | 60 | 320 | 15 | 30 | .5 | 49 | 231 | 231 | 0 | |
| 34-6-16baa | 70.0 | Permian | 8-23-1956 | 55 | 552 | 17 | .7 | 69 | 24 | 99 | 383 | 60 | 55 | .2 | 39 | 270 | 270 | 0 |
| 34-6-32bcb | 31.0 | Permian | 4-24-1956 | 57 | 638 | 13 | .09 | 43 | 26 | 162 | 444 | 84 | 67 | .5 | 24 | 214 | 214 | 0 |
| 34-7-8aaa | 35.0 | Kansan deposits |
8-25-1956 | 56 | 1,190 | 16 | .12 | 84 | 38 | 262 | 359 | 117 | 193 | .2 | 305 | 366 | 294 | 72 |
| 34-9-18bbb | 25.0 | Permian | 4-25-1956 | 56 | 1,330 | 16 | .05 | 81 | 91 | 269 | 659 | 174 | 232 | .4 | 137 | 576 | 540 | 36 |
| 35-9-5bbb | 30.0 | Permian | 4-25-1956 | 56 | 5,040 | 12 | 1.4 | 256 | 146 | 1,308 | 487 | 1,525 | 1,400 | 1.7 | 146 | 1,240 | 400 | 840 |
Figure 14--Graphic representation of chemical character of ground water in Harper County.
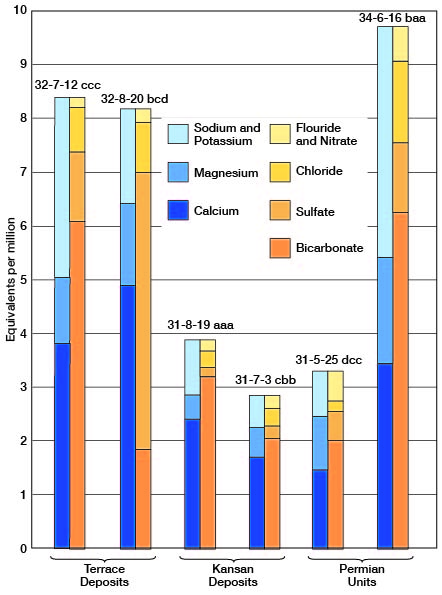
Figure 15--Graphic representation of chemical character of ground water in Harper County.
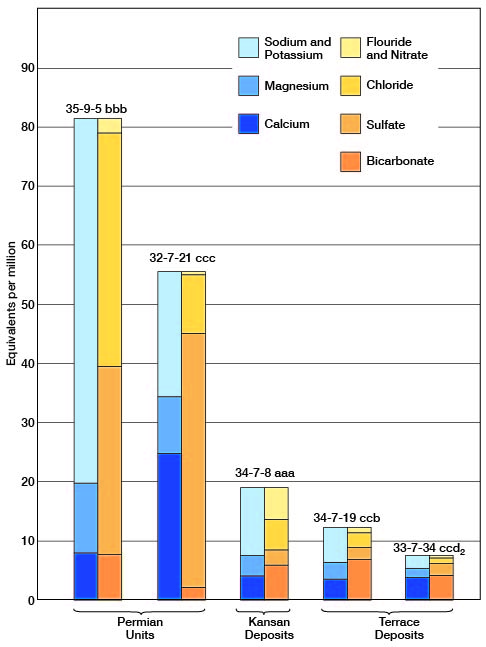
The concentrations of mineral constituents is given in ppm (parts per million) in Table 6. In order to show the constituents in terms of chemical equivalence, the analyses of Figures 14 and 15 have been expressed in epm (equivalents per million). To convert ppm to epm, the parts per million value is multiplied by the reciprocal of the combining weight of the appropriate ion (Table 7).
Table 7--Factors for converting parts per million of mineral constituents to equivalents per million.
| Cation | Conversion factor |
Anion | Conversion factor |
|---|---|---|---|
| Ca++ | 0.0499 | HCO3- | 0.0164 |
| Mg++ | 0.0822 | SO4-- | 0.0208 |
| Na+ | 0.0435 | Cl- | 0.0282 |
| NO3- | 0.0161 | ||
| F- | 0.0526 |
The samples of water from wells in Harper County were analyzed by Howard A. Stoltenberg, chemist, Water and Sewage Laboratory of the State Board of Health at Topeka. The analyses show only the dissolved mineral constituents of the water and do not indicate sanitary conditions.
Chemical Constituents in Relation to Use
Table 8 shows the concentration ranges of dissolved solids, hardness, iron, chloride, sulfate, fluoride, and nitrate in samples of water from typical wells in Harper County by geologic units.
Table 8--Dissolved mineral constituents and hardness of water from aquifers in Harper County.
| Range, in parts per million | Number of samples and aquifers | ||
|---|---|---|---|
| Permian | Lower Pleistocene |
Upper Pleistocene |
|
| Dissolved solids | |||
| Less than 250 | 1 | 3 | 0 |
| 250-500 | 2 | 2 | 8 |
| 501-1,000 | 8 | 1 | 1 |
| More than 1,000 | 5 | 1 | 0 |
| Total hardness | |||
| Less than 150 | 1 | 2 | 0 |
| 150-300 | 4 | 3 | 7 |
| 301-500 | 5 | 2 | 3 |
| More than 500 | 5 | 0 | 0 |
| Iron | |||
| Less than 0. 1 | 6 | 0 | 3 |
| 0.1-0.3 | 3 | 5 | 4 |
| 0.31-1.0 | 3 | 2 | 2 |
| More than 1. 0 | 2 | 0 | 1 |
| Chloride | |||
| Less than 50 | 6 | 5 | 8 |
| 50-250 | 6 | 2 | 2 |
| 251-500 | 2 | 0 | 0 |
| More than 500 | 1 | 0 | 0 |
| Sulfate | |||
| Less than 100 | 8 | 6 | 8 |
| 100-250 | 3 | 2 | 1 |
| 251-500 | 1 | 0 | 0 |
| More than 500 | 3 | 0 | 0 |
| Fluoride | |||
| Less than 0.5 | 7 | 6 | 8 |
| 0.5-1.0 | 6 | 1 | 2 |
| 1.1-1.5 | 1 | 0 | 0 |
| More than 1.5 | 1 | 0 | 0 |
| Nitrate | |||
| Less than 45 | 10 | 4 | 9 |
| 45-90 | 1 | 0 | 0 |
| More than 90 | 4 | 3 | 1 |
Dissolved solids--Ground water dissolves some of the rock materials with which it comes in contact. After a natural water has been evaporated, the residue consists of mineral matter, some organic matter, and water of crystallization. The kind and quantity of the minerals determine the suitability of the water for various uses. Water containing less than 500 ppm of dissolved solids generally is satisfactory for domestic use. Water containing more than 1,000 ppm of dissolved solids may include enough of certain constituents to cause a noticeable taste or to make the water unsuitable for use in some other respect.
Hardness--Hardness, the property that in Harper County generally receives the most attention, is commonly recognized by the soap-consuming power of the water. Calcium and magnesium cause nearly all the hardness of ordinary water. These constituents also are the active agents in the formation of scale in steam boilers and other containers in which water is heated or evaporated.
The total hardness, the carbonate hardness, and the noncarbonate hardness of the water samples are given in Table 6. The carbonate hardness, or "temporary hardness," is caused by calcium and magnesium bicarbonates and can be almost entirely removed by boiling. The noncarbonate hardness, or "permanent hardness," is caused by sulfates and chlorides of calcium and magnesium and other salts and cannot be removed by boiling. Carbonate and noncarbonate hardness have the same effect in the consumption of soap.
Water having a hardness of less than 50 ppm is regarded as soft, and treatment for its removal under ordinary circumstances is not necessary. Hardness of 50 to 150 ppm does not seriously interfere with the use of water for most purposes but does increase the use of soap. Laundries or other industries using large quantities of soap, or to which hardness is objectionable in some way other than through excessive soap consumption, may profitably soften such water. A hardness of more than 150 ppm is easily noticeable and if it is much greater than 150 ppm softening generally is practical. When municipal supplies are softened, the hardness is generally reduced to about 100 ppm. The advantage of further softening of municipal supplies may not be economically justified. In most softening processes only the bicarbonate or "temporary" hardness is removed.
The hardness of samples of water from wells in Harper County ranged from 112 to 1,720 ppm. Table 8 gives the ranges of hardness in the 32 samples of water from the three chief aquifers in the county.
Iron--Next to hardness, iron is the constituent in the water in Harper County that generally is most objectionable. Even in ground water from the same formation, the quantity of iron may differ greatly from place to place. If the water contains more than 0.3 ppm, the iron upon oxidation may settle out as a reddish sediment. Iron, present in sufficient quantity, gives a disagreeable taste to water, stains cooking utensils and plumbing fixtures, and is objectionable if used in the preparation of foods and beverages. Generally iron may be removed by aeration followed by settling or filtration, but some water requires treatment with chemicals.
Thirty-one samples of water from Harper County were analyzed for iron content, which ranged from 0.05 to 2.0 ppm (Table 8).
Chloride--Chloride compounds are found in abundance in nature. They occur in sea water and in oil-field brines and are dissolved in widely varying quantities from many rock materials. Chloride has little effect on the suitability of water for ordinary use unless present in sufficient quantity to make the water unpotable. Water containing excessive chloride may be corrosive if used in steam boilers. The removal of the chloride ions from water is difficult and expensive. The concentration of chloride in the 32 samples of water from Harper County ranged from 11 to 1,400 ppm (Table 6). Only one sample contained chloride in excess of 500 ppm, and all samples were suitable for stock use (Table 8).
Sulfate--Sulfates of calcium or magnesium contribute most of the "permanent hardness" to a natural water, and the removal of these salts is both difficult and expensive. Sulfates in excessive amounts are undesirable in a domestic or stock water supply because of their laxative effect. A concentration limit of 250 ppm of sulfate is recommended for drinking water. Water containing more than 250 ppm if used for drinking may initially have a laxative effect. Sulfate concentrations as great as 2,000 ppm can be tolerated by man, and the tolerance by cattle is somewhat greater.
In Harper County the concentration of sulfate ranged from 7 to 2,070 ppm but only four samples had a concentration in excess of 250 ppm. Table 8 gives the number of samples in various ranges of concentration of sulfate from the three principal aquifers in Harper County.
Fluoride--Although the quantities of fluoride are relatively small as compared with those of other common constituents of natural water, the amount of fluoride in drinking water that is used by children should be known. Fluoride is associated with the dental defect known as mottled enamel, which may appear on the teeth of children who, during the formation of their permanent teeth, habitually drink water containing amounts in excess of about 1.5 ppm (Dean, 1936). Small quantities of fluoride in the drinking water, about 1.0 ppm, are not sufficient to cause mottled enamel but are beneficial, by preventing or decreasing the incidence of caries in the permanent teeth of children (Dean and others, 1941). Fluoride has been added to many public water supplies in recent years, generally in concentration of about 1 ppm.
In Harper County only one sample of water contained fluoride in excess of 1.5 ppm. This water is strongly mineralized and is not used for domestic purposes. Table 8 gives the number of samples in various ranges of concentration of fluoride from the three chief aquifers in the county.
Nitrate--Recent investigations have caused considerable interest in the amount of nitrate in drinking water. Large amounts of nitrate may cause cyanosis in infants if the water is used for drinking or in preparation of a formula. Infant cyanosis may be fatal if water containing much nitrate is used continually. Water containing more than 90 ppm of nitrate, if used continually, is regarded by the Kansas State Board of Health as likely to cause cyanosis (Metzler and Stoltenberg, 1950). In Harper County 23 samples of water had less than 45 ppm of nitrate, 1 sample contained between 45 and 90 ppm, and 8 samples had more than 90 ppm.
Chemical Constituents in Relation to Irrigation
This discussion of the suitability of water for irrigation is adapted from Agriculture Handbook 60 of the U. S. Department of Agriculture. (U. S. Salinity Laboratory Staff, 1954.)
The development and maintenance of successful irrigation projects involve not only supplying irrigation water to the land but also control of the salinity and alkalinity of the soil. The quality of irrigation water, irrigation practices, and drainage conditions affect salinity and alkali control. Soil that was originally nonsaline and nonalkali may become unproductive if excessive soluble salts or exchangeable sodium are allowed to accumulate because of improper irrigation and soil-management practices or inadequate drainage.
In areas of sufficient rainfall and ideal soil conditions the soluble salts originally present in the soil, or those added to the soil with water, are carried downward by the water and may ultimately reach the water table. The process of dissolving and transporting soluble salts by water moving through the soil is called leaching. If the amount of water applied to the soil is not in excess of the plant need, there will be no downward percolation of water below the root zone, and mineral matter will accumulate at the root zone. Likewise, impermeable soil zones near the surface can retard the downward movement of water and cause waterlogging of the soil and deposition of salts. Unless drainage is adequate, attempts at leaching may not be successful, because leaching requires the free passage of water through and away from the root zone.
The characteristics of an irrigation water that are most important in determining its quality are (1) the total concentration of soluble salts; (2) the relative proportion of sodium to the other principal cations (calcium, magnesium, and potassium); (3) the concentration of boron or other toxic elements; and (4) under some conditions, the concentration of bicarbonate as related to that of calcium and magnesium.
For diagnosis and classification of irrigation water the total concentration of soluble salts can be adequately expressed in terms of electrical conductivity, which is the measure of the ability of the ionized inorganic salts in solution to conduct an electrical current, and is usually expressed in terms of micromhos per centimeter at 25° C. The electrical conductivity can be determined accurately in the laboratory, or a rough approximation of the electrical conductivity can be obtained by multiplying by 100 the total content of calcium, sodium, magnesium, and potassium expressed as equivalents per million, or by dividing the dissolved solids expressed in parts per million by a factor of 0.6 to 0.7. In general, water having an electrical conductivity below 750 micromhos per centimeter is satisfactory for irrigation insofar as salt content is concerned, although salt-sensitive crops such as strawberries, green beans, and red clover may be adversely affected by irrigation water having an electrical conductivity in the range of 250 to 750 micromhos per centimeter. Water in the range of 750 to 2,250 micromhos per centimeter is widely used, and satisfactory crop growth is obtained under good management and favorable drainage conditions, but saline conditions will develop if leaching and drainage are inadequate. Use of water having a conductivity of more than 2,250 micromhos per centimeter is not common, and very few instances can be cited where such waters have been used successfully.
In the past the relative proportion of sodium to other cations in irrigation water usually has been expressed simply as the percentage of sodium or percent sodium of the principal cations (expressed in equivalents). According to the U. S. Salinity Laboratory Staff (1954), the sodium-adsorption ratio (SAR), used to express the relative activity of sodium ions in exchange reactions with soil, is a better index of the suitability of water for irrigation with respect to the sodium (alkali) hazard. The sodium-adsorption ratio may be determined by the formula:
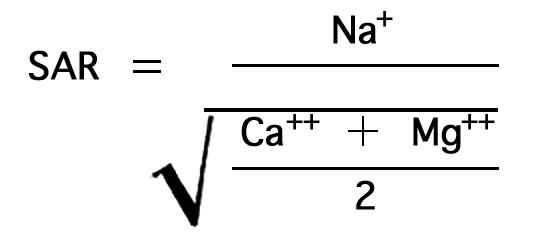
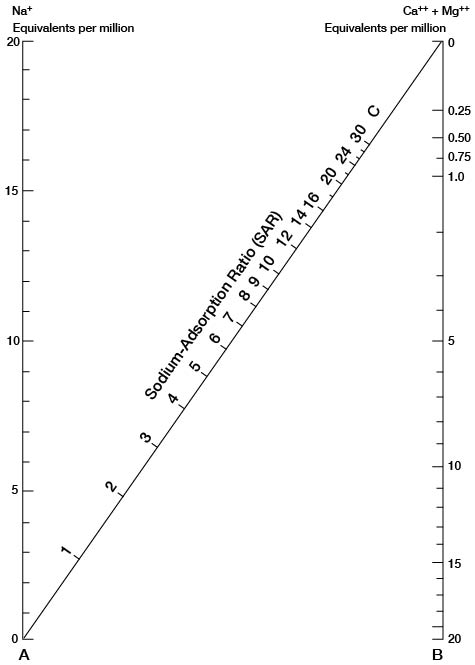
in which the ionic concentrations are expressed in equivalents per million (Table 7). The sodium-adsorption ratio may be determined also by use of the nomogram in Figure 16. In using this nomogram, the concentration of sodium expressed in equivalents per million is plotted on the left-hand scale and the concentration of calcium plus that of magnesium expressed in equivalents per million is plotted on the right-hand scale. The value at the point at which a line connecting these two points intersects the scale for the sodium-adsorption ratio is the sodium-adsorption ratio of the water.
Figure 16--Nomogram used to compute sodium-adsorption ratio of water.
When the sodium-adsorption ratio and the electrical conductivity of the water are known, the classification of the water for irrigation can be determined by graphically plotting these values on the diagram shown in Figure 17. Table 9 gives the sodium-adsorption ratio, the electrical conductivity, and the classification of the 32 samples of water from Harper County. Low-sodium water (S1) can be used for irrigation on almost all soils with little danger of development of harmful levels of exchangeable sodium. Medium-sodium water (S2) will present an appreciable sodium hazard in certain fine-textured soils, especially poorly leached soils. Such water can be used safely on coarse-textured or organic (permeable) soils. High-sodium water (S3) may produce harmful levels of exchangeable sodium in most soils and will require special soil management such as good drainage and leaching and the addition of organic matter. Very high sodium water (S4) is generally unsatisfactory for irrigation unless special precautions are taken, such as the addition of gypsum to the soil.
Figure 17--Classification of water for irrigation.
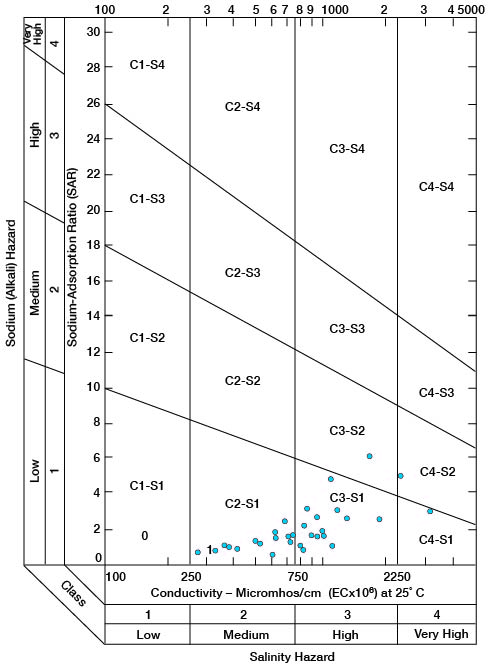
Table 9--Classification of water for irrigation.
| Well number | Electrical conductivity |
SAR | Classification |
|---|---|---|---|
| 31-5-10aaa | 690 | 2.4 | C2-S1 |
| 31-5-25dcc | 330 | .8 | C2-S1 |
| 31-6-1cdd | 1,020 | 1.9 | C3-S1 |
| 31-6-5daa | 20 | .5 | C2-S1 |
| 31-6-32aab | 3,370 | 2.9 | C4-S1 |
| 31-7-3cbb | 283 | .8 | C2-S1 |
| 31-8-14cdd | 420 | .8 | C2-S1 |
| 31-8-19aaa | 390 | 1.0 | C2-S1 |
| 31-9-16ddd | 510 | 1.0 | C2-S1 |
| 32-5-13cbb | 910 | 1.8 | C3-S1 |
| 32-6-4dcc | 640 | 1.5 | C2-S1 |
| 32-6-35daa | 1,050 | 1.8 | C3-S1 |
| 32-7-4dcc | 530 | 1.2 | C2-S1 |
| 32-7-11add2 | 620 | 1.9 | C2-S1 |
| 32-7-12ccc1 | 840 | 2.0 | C3-S1 |
| 32-7-21ccc | 5,520 | 5+ | |
| 32-8-4ddd | 1,900 | 2.8 | C3-S1 |
| 32-8-20bcd | 820 | 1.0 | C3-S1 |
| 32-8-32aba | 990 | 1.5 | C3-S1 |
| 32-9-17ccd | 840 | 1.0 | C3-S1 |
| 32-9-19ccb | 1,200 | 3.2 | C3-S1 |
| 33-5-4ddd | 1,370 | 2.7 | C3-S1 |
| 33-5-30ddd | 880 | 3.2 | C3-S1 |
| 33-7-32ccd2 | 730 | 1.3 | C2-S1 |
| 33-8-13ddd | 1,160 | 1.0 | C3-S1 |
| 33-9-5baa | 750 | 1.8 | C2-S1 |
| 34-5-29bbb | 720 | 1.7 | C2-S1 |
| 34-6-16baa | 970 | 2.7 | C3-S1 |
| 34-6-32bcd | 1,130 | 5.0 | C3-S1 |
| 34-7-8aaa | 1,870 | 6.0 | C3-S2 |
| 34-9-18bbb | 2,320 | 4.9 | C4-S2 |
| 35-9-5bbb | 8,160 | 16+ |
Low-salinity water (C1) can be used for irrigation of most crops on most soils with little likelihood that excessive salinity will develop. Medium-salinity water (C2) can be used if a moderate amount of leaching occurs. Crops of moderate salt tolerance such as potatoes, corn, alfalfa, wheat, and oats can be irrigated with C2 water without special precautions. High-salinity water (C3) cannot be used on soils of restricted drainage, and very high salinity water (C4) is not suitable for irrigation under ordinary conditions. It can be used only on crops of extreme salt tolerance, and then only if much leaching takes place.
Boron is essential to plant growth but only in very small quantities; excessive quantities are harmful to most crops. Crops differ greatly in their boron tolerance, but in general the ordinary field crops common to Kansas are not adversely affected by boron concentrations of less than 1 ppm.
In water containing much bicarbonate, there is a tendency for calcium and magnesium to precipitate as the soil water becomes more concentrated because of evaporation and plant uptake. This reaction ordinarily does not go to completion, but insofar as it does proceed, there is a reduction in the concentration of calcium and magnesium in the water and therefore a relative increase in sodium. The calcium and magnesium are precipitated as carbonate and any residual carbonate or bicarbonate is left in solution as sodium carbonate. The potential amount of "residual sodium carbonate" may be computed as (Na2CO3) = (CO3-- + HCO3-) - (CA++ + Mg++), where the ionic concentrations are expressed as milliequivalents per liter or equivalents per million.
On the basis of limited data and using the "residual sodium carbonate" concept described above, the Department of Agriculture concluded that water having more than 2.5 epm or meq/l (milliequivalents per liter) of residual sodium carbonate is not suitable for irrigation. Water containing 1.25 to 2.50 epm of residual sodium carbonate is regarded as marginal, and water containing less than 1.25 epm is judged to be safe.
In appraising the quality of an irrigation water, first consideration must be given to the salinity and alkali hazards as classified in Figure 17. Then consideration should be given to other objectionable characteristics, such as boron and other toxic elements and bicarbonate, any one of which alters the quality rating.
Prev Page--Ground water Occurrence, Recover, Utilization || Next Page--Formations
Kansas Geological Survey, Geology
Placed on web Feb. 27, 2009; originally published March, 1960.
Comments to webadmin@kgs.ku.edu
The URL for this page is http://www.kgs.ku.edu/General/Geology/Harper/05_gw.html