| Year | Oil | Gas | ||||
|---|---|---|---|---|---|---|
| Production (bbls) |
Wells | Cumulative (bbls) |
Production (mcf) |
Wells | Cumulative (mcf) |
|
| 1995 | 21,844 | 45 | 2,985,557 | - | - | 74,000 |
| 1996 | 20,506 | 44 | 3,006,063 | - | - | 74,000 |
| 1997 | 17,592 | 43 | 3,023,655 | - | - | 74,000 |
| 1998 | 13,555 | 37 | 3,037,210 | - | - | 74,000 |
| 1999 | 15,677 | 33 | 3,052,887 | - | - | 74,000 |
| 2000 | 14,501 | 31 | 3,067,388 | - | - | 74,000 |
| 2001 | 12,163 | 33 | 3,079,551 | - | - | 74,000 |
| 2002 | 12,254 | 28 | 3,091,805 | - | - | 74,000 |
| 2003 | 12,354 | 35 | 3,104,159 | - | - | 74,000 |
| 2004 | 11,795 | 34 | 3,115,954 | - | - | 74,000 |
| 2005 | 11,535 | 32 | 3,127,489 | - | - | 74,000 |
| 2006 | 12,538 | 32 | 3,140,027 | - | - | 74,000 |
| 2007 | 11,070 | 31 | 3,151,097 | - | - | 74,000 |
| 2008 | 10,140 | 31 | 3,161,237 | - | - | 74,000 |
| 2009 | 7,897 | 30 | 3,169,134 | - | - | 74,000 |
| 2010 | 8,889 | 31 | 3,178,023 | - | - | 74,000 |
| 2011 | 8,229 | 30 | 3,186,252 | - | - | 74,000 |
| 2012 | 9,073 | 29 | 3,195,325 | - | - | 74,000 |
| 2013 | 8,590 | 29 | 3,203,915 | - | - | 74,000 |
| 2014 | 7,877 | 32 | 3,211,792 | - | - | 74,000 |
| 2015 | 6,672 | 27 | 3,218,464 | - | - | 74,000 |
| 2016 | 6,594 | 30 | 3,225,058 | - | - | 74,000 |
| 2017 | 6,824 | 30 | 3,231,882 | - | - | 74,000 |
| 2018 | 6,380 | 29 | 3,238,262 | - | - | 74,000 |
| 2019 | 5,188 | 28 | 3,243,450 | - | - | 74,000 |
| 2020 | 4,290 | 25 | 3,247,740 | - | - | 74,000 |
| 2021 | 5,239 | 21 | 3,252,979 | - | - | 74,000 |
| 2022 | 5,607 | 24 | 3,258,586 | - | - | 74,000 |
| 2023 | 6,015 | 21 | 3,264,601 | - | - | 74,000 |
| 2024 | 2,766 | 13 | 3,267,367 | - | - | 74,000 |


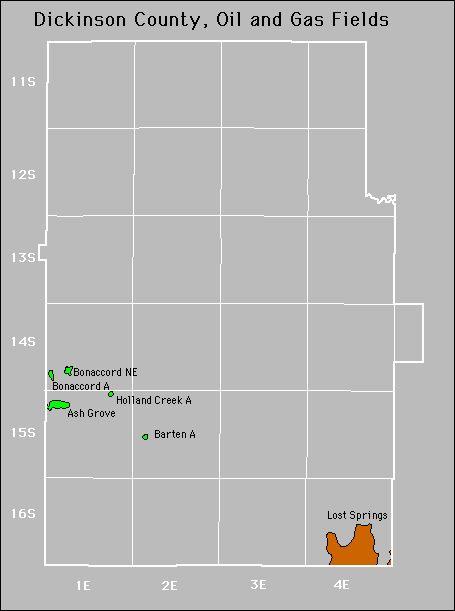
| Active | |||
|---|---|---|---|
| Ash Grove Barten |
Holland Creek Lost Springs |
||
Abandoned