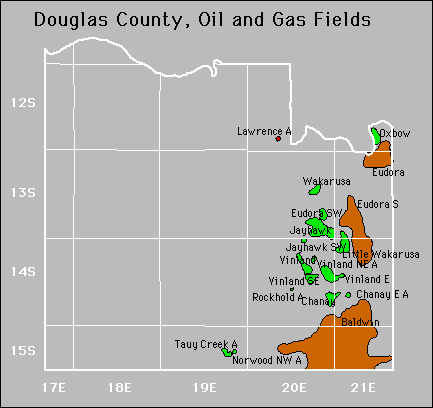
| Year | Oil | Gas | ||||
|---|---|---|---|---|---|---|
| Production (bbls) |
Wells | Cumulative (bbls) |
Production (mcf) |
Wells | Cumulative (mcf) |
|
| 1995 | 73,927 | 156 | 2,072,298 | - | - | 135,033 |
| 1996 | 64,694 | 331 | 2,136,992 | - | - | 135,033 |
| 1997 | 59,389 | 317 | 2,196,381 | - | - | 135,033 |
| 1998 | 50,552 | 306 | 2,246,933 | - | - | 135,033 |
| 1999 | 41,913 | 271 | 2,288,846 | - | - | 135,033 |
| 2000 | 36,632 | 268 | 2,325,478 | - | - | 135,033 |
| 2001 | 32,671 | 260 | 2,358,149 | - | - | 135,033 |
| 2002 | 32,401 | 256 | 2,390,550 | - | - | 135,033 |
| 2003 | 31,705 | 261 | 2,422,255 | - | - | 135,033 |
| 2004 | 30,592 | 250 | 2,452,847 | - | - | 135,033 |
| 2005 | 29,193 | 261 | 2,482,040 | - | - | 135,033 |
| 2006 | 37,217 | 273 | 2,519,257 | - | - | 135,033 |
| 2007 | 37,515 | 274 | 2,556,772 | - | - | 135,033 |
| 2008 | 45,585 | 313 | 2,602,357 | - | - | 135,033 |
| 2009 | 56,461 | 336 | 2,658,818 | - | - | 135,033 |
| 2010 | 53,030 | 407 | 2,711,848 | - | - | 135,033 |
| 2011 | 46,134 | 399 | 2,757,982 | - | - | 135,033 |
| 2012 | 51,718 | 419 | 2,809,700 | - | - | 135,033 |
| 2013 | 64,134 | 440 | 2,873,834 | - | - | 135,033 |
| 2014 | 72,835 | 449 | 2,946,669 | - | - | 135,033 |
| 2015 | 59,281 | 460 | 3,005,950 | - | - | 135,033 |
| 2016 | 50,502 | 439 | 3,056,452 | - | - | 135,033 |
| 2017 | 45,591 | 477 | 3,102,043 | - | - | 135,033 |
| 2018 | 38,050 | 446 | 3,140,093 | - | - | 135,033 |
| 2019 | 30,858 | 347 | 3,170,951 | - | - | 135,033 |
| 2020 | 26,881 | 349 | 3,197,832 | - | - | 135,033 |
| 2021 | 24,301 | 341 | 3,222,133 | - | - | 135,033 |
| 2022 | 26,000 | 388 | 3,248,133 | - | - | 135,033 |
| 2023 | 25,680 | 394 | 3,273,813 | - | - | 135,033 |
| 2024 | 22,560 | 359 | 3,296,373 | - | - | 135,033 |


No Abandoned fields.