| Year | Oil | Gas | ||||
|---|---|---|---|---|---|---|
| Production (bbls) |
Wells | Cumulative (bbls) |
Production (mcf) |
Wells | Cumulative (mcf) |
|
| 1995 | 375,360 | 398 | 31,415,801 | 4,526,006 | 278 | 233,750,022 |
| 1996 | 365,674 | 415 | 31,781,475 | 4,554,502 | 339 | 238,304,524 |
| 1997 | 354,962 | 421 | 32,136,437 | 4,563,760 | 338 | 242,868,284 |
| 1998 | 362,414 | 403 | 32,498,851 | 4,479,795 | 337 | 247,348,079 |
| 1999 | 348,845 | 403 | 32,847,696 | 4,122,519 | 320 | 251,470,598 |
| 2000 | 306,317 | 409 | 33,154,013 | 3,981,796 | 317 | 255,452,394 |
| 2001 | 327,132 | 416 | 33,481,145 | 4,026,646 | 336 | 259,479,040 |
| 2002 | 331,723 | 412 | 33,812,868 | 4,291,651 | 332 | 263,770,691 |
| 2003 | 333,219 | 419 | 34,146,087 | 4,147,040 | 331 | 267,917,731 |
| 2004 | 340,049 | 433 | 34,486,136 | 4,364,271 | 331 | 272,282,002 |
| 2005 | 347,468 | 438 | 34,833,604 | 4,687,340 | 372 | 276,969,342 |
| 2006 | 349,717 | 457 | 35,183,321 | 4,987,995 | 375 | 281,957,337 |
| 2007 | 329,266 | 457 | 35,512,587 | 4,940,213 | 507 | 286,897,550 |
| 2008 | 324,068 | 485 | 35,836,655 | 5,071,674 | 403 | 291,969,224 |
| 2009 | 321,933 | 487 | 36,158,588 | 4,917,531 | 405 | 296,886,755 |
| 2010 | 361,448 | 501 | 36,520,036 | 5,050,316 | 444 | 301,937,071 |
| 2011 | 506,877 | 509 | 37,026,913 | 5,202,539 | 468 | 307,139,610 |
| 2012 | 873,056 | 537 | 37,899,969 | 7,408,328 | 524 | 314,547,938 |
| 2013 | 1,734,019 | 609 | 39,633,988 | 13,544,374 | 593 | 328,092,312 |
| 2014 | 2,934,109 | 698 | 42,568,097 | 24,358,304 | 673 | 352,450,616 |
| 2015 | 3,573,071 | 692 | 46,141,168 | 31,898,861 | 701 | 384,349,477 |
| 2016 | 2,079,562 | 656 | 48,220,730 | 27,311,079 | 662 | 411,660,556 |
| 2017 | 996,772 | 629 | 49,217,502 | 20,338,258 | 646 | 431,998,814 |
| 2018 | 728,680 | 605 | 49,946,182 | 17,064,033 | 632 | 449,062,847 |
| 2019 | 540,505 | 603 | 50,486,687 | 13,974,620 | 626 | 463,037,467 |
| 2020 | 322,137 | 496 | 50,808,824 | 9,438,770 | 579 | 472,476,237 |
| 2021 | 296,938 | 467 | 51,105,762 | 8,151,943 | 562 | 480,628,180 |
| 2022 | 257,560 | 454 | 51,363,322 | 8,118,933 | 559 | 488,747,113 |
| 2023 | 230,452 | 443 | 51,593,774 | 5,824,250 | 536 | 494,571,363 |
| 2024 | 180,683 | 361 | 51,774,457 | 4,900,554 | 493 | 499,471,917 |


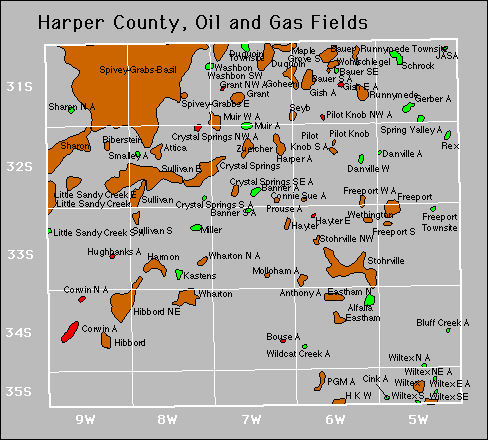
Abandoned
Banner
Banner South
Bauer South
Bluff Creek
Grant Northwest
Hughbanks