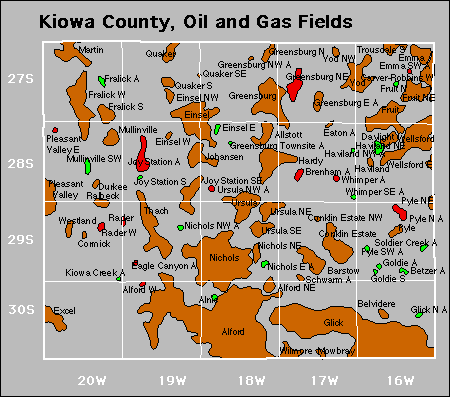
| Year | Oil | Gas | ||||
|---|---|---|---|---|---|---|
| Production (bbls) |
Wells | Cumulative (bbls) |
Production (mcf) |
Wells | Cumulative (mcf) |
|
| 1995 | 470,294 | 354 | 26,524,367 | 8,812,347 | 233 | 496,689,822 |
| 1996 | 447,819 | 312 | 26,972,186 | 7,997,639 | 226 | 504,687,461 |
| 1997 | 404,071 | 284 | 27,376,257 | 7,156,489 | 215 | 511,843,950 |
| 1998 | 371,993 | 268 | 27,748,250 | 6,227,152 | 207 | 518,071,102 |
| 1999 | 352,390 | 272 | 28,100,640 | 5,941,782 | 202 | 524,012,884 |
| 2000 | 334,064 | 272 | 28,434,704 | 5,538,882 | 197 | 529,551,766 |
| 2001 | 304,582 | 251 | 28,739,286 | 5,401,057 | 200 | 534,952,823 |
| 2002 | 332,549 | 265 | 29,071,835 | 5,372,207 | 207 | 540,325,030 |
| 2003 | 298,208 | 268 | 29,370,043 | 4,945,219 | 211 | 545,270,249 |
| 2004 | 300,284 | 265 | 29,670,327 | 4,887,068 | 224 | 550,157,317 |
| 2005 | 279,551 | 264 | 29,949,878 | 4,987,721 | 224 | 555,145,038 |
| 2006 | 302,329 | 266 | 30,252,207 | 4,536,368 | 227 | 559,681,406 |
| 2007 | 293,065 | 265 | 30,545,272 | 4,067,581 | 230 | 563,748,987 |
| 2008 | 292,117 | 264 | 30,837,389 | 3,753,390 | 237 | 567,502,377 |
| 2009 | 261,555 | 264 | 31,098,944 | 3,355,022 | 238 | 570,857,399 |
| 2010 | 268,390 | 267 | 31,367,334 | 3,113,497 | 228 | 573,970,896 |
| 2011 | 319,765 | 275 | 31,687,099 | 2,907,820 | 228 | 576,878,716 |
| 2012 | 433,065 | 284 | 32,120,164 | 2,836,135 | 226 | 579,714,851 |
| 2013 | 436,691 | 302 | 32,556,855 | 2,674,455 | 221 | 582,389,306 |
| 2014 | 521,272 | 292 | 33,078,127 | 2,706,649 | 219 | 585,095,955 |
| 2015 | 459,527 | 274 | 33,537,654 | 2,595,555 | 212 | 587,691,510 |
| 2016 | 371,277 | 273 | 33,908,931 | 2,307,467 | 191 | 589,998,977 |
| 2017 | 337,289 | 271 | 34,246,220 | 2,176,715 | 179 | 592,175,692 |
| 2018 | 322,926 | 259 | 34,569,146 | 1,888,382 | 174 | 594,064,074 |
| 2019 | 290,674 | 260 | 34,859,820 | 1,756,922 | 174 | 595,820,996 |
| 2020 | 229,683 | 236 | 35,089,503 | 1,667,203 | 157 | 597,488,199 |
| 2021 | 224,137 | 251 | 35,313,640 | 1,577,495 | 141 | 599,065,694 |
| 2022 | 225,036 | 241 | 35,538,676 | 1,572,389 | 156 | 600,638,083 |
| 2023 | 199,139 | 239 | 35,737,815 | 1,439,547 | 135 | 602,077,630 |
| 2024 | 170,017 | 231 | 35,907,832 | 1,214,348 | 127 | 603,291,978 |


Abandoned