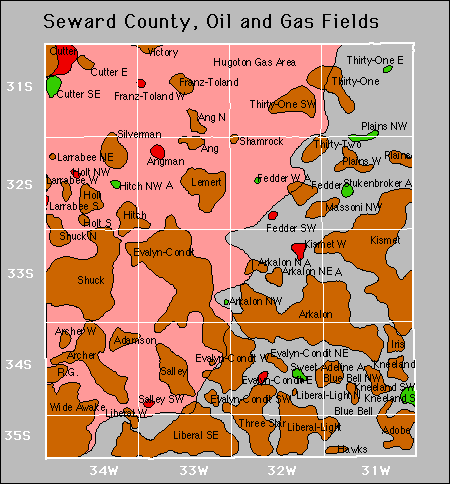
| Year | Oil | Gas | ||||
|---|---|---|---|---|---|---|
| Production (bbls) |
Wells | Cumulative (bbls) |
Production (mcf) |
Wells | Cumulative (mcf) |
|
| 1995 | 1,681,171 | 330 | 35,829,721 | 40,147,826 | 957 | 1,476,817,849 |
| 1996 | 1,374,289 | 325 | 37,204,010 | 43,771,036 | 1019 | 1,520,588,885 |
| 1997 | 1,132,005 | 336 | 38,336,015 | 42,264,702 | 1062 | 1,562,853,587 |
| 1998 | 1,137,947 | 301 | 39,473,962 | 37,281,919 | 1084 | 1,600,135,506 |
| 1999 | 843,902 | 310 | 40,317,864 | 33,834,506 | 1068 | 1,633,970,012 |
| 2000 | 740,301 | 303 | 41,058,165 | 31,713,194 | 1081 | 1,665,683,206 |
| 2001 | 672,883 | 292 | 41,731,048 | 29,020,869 | 1112 | 1,694,704,075 |
| 2002 | 556,008 | 294 | 42,287,056 | 25,936,687 | 1116 | 1,720,640,762 |
| 2003 | 499,066 | 266 | 42,786,122 | 25,082,167 | 1126 | 1,745,722,929 |
| 2004 | 477,621 | 251 | 43,263,743 | 25,124,222 | 1152 | 1,770,847,151 |
| 2005 | 452,795 | 258 | 43,716,538 | 24,946,452 | 1168 | 1,795,793,603 |
| 2006 | 451,708 | 254 | 44,168,246 | 25,517,095 | 1212 | 1,821,310,698 |
| 2007 | 454,002 | 255 | 44,622,248 | 23,770,806 | 1228 | 1,845,081,504 |
| 2008 | 423,870 | 266 | 45,046,118 | 21,696,584 | 1239 | 1,866,778,088 |
| 2009 | 416,075 | 260 | 45,462,193 | 20,512,130 | 1236 | 1,887,290,218 |
| 2010 | 380,333 | 250 | 45,842,526 | 17,182,677 | 1200 | 1,904,472,895 |
| 2011 | 360,104 | 239 | 46,202,630 | 15,272,440 | 1174 | 1,919,745,335 |
| 2012 | 371,291 | 256 | 46,573,921 | 14,286,962 | 1164 | 1,934,032,297 |
| 2013 | 356,508 | 247 | 46,930,429 | 13,013,678 | 1139 | 1,947,045,975 |
| 2014 | 385,406 | 246 | 47,315,835 | 11,862,526 | 1133 | 1,958,908,501 |
| 2015 | 512,838 | 237 | 47,828,673 | 11,599,288 | 1109 | 1,970,507,789 |
| 2016 | 393,812 | 243 | 48,222,485 | 10,406,774 | 1073 | 1,980,914,563 |
| 2017 | 351,955 | 232 | 48,574,440 | 9,687,529 | 1034 | 1,990,602,092 |
| 2018 | 381,262 | 228 | 48,955,702 | 9,112,809 | 1009 | 1,999,714,901 |
| 2019 | 335,989 | 214 | 49,291,691 | 8,362,529 | 976 | 2,008,077,430 |
| 2020 | 275,332 | 190 | 49,567,023 | 7,436,106 | 934 | 2,015,513,536 |
| 2021 | 283,938 | 179 | 49,850,961 | 6,845,754 | 901 | 2,022,359,290 |
| 2022 | 263,904 | 188 | 50,114,865 | 6,413,104 | 880 | 2,028,772,394 |
| 2023 | 297,883 | 163 | 50,412,748 | 5,994,971 | 857 | 2,034,767,365 |
| 2024 | 245,236 | 168 | 50,657,984 | 4,953,643 | 829 | 2,039,721,008 |


Abandoned