
Kansas Geological Survey, Open-file Report 91-52, p. 109-122
Certified Petroleum Geologist
Independence, Kansas
Producing gas commercially from buried coals is possible assuming the coal contains enough gas. The gas content of buried coals must be determined at the well site by collecting a fresh sample of coal and immediately sealing it in a canister of simple design. Cores are preferred, but drill chips are satisfactory and more cost effective. Chips desorb their gas faster than a core, which may require months. Once sealed, the volume of desorbed gas is measured in the office. After determining the total volume of gas desorbed, further laboratory work consists of drying and weighing the sample, eliminating contaminants if using drill chips, and establishing the rank, ash content, and specific gravity of the coal. With these data in hand, the coal's gas content is calculated in cc's per gram which is converted to cubic feet per ton by multiplying by 32. Cubic feet per ton is converted to thousand cubic feet per acre foot (Mcf/acre-ft) of coal by utilizing the coal's density. Subsequently, further development is justified based on reliable volumetric estimates of gas in-place. The rank of some eastern Kansas coals based on their chemistry is High Volatile A (HVA). However, vitrinite reflectance on the same coal indicates a rank of High Volatile C (HVC). The measured gas content of several hundred cubic feet per ton helps to confirm the rank as HVA rather than HVC. The direct method of measuring a coal's gas content is described giving examples and laboratory tabulation sheets.
At least one trillion cubic feet of in-place gas is thought to be waiting for the drill bit in eastern Kansas in coal beds 42 inches thick or thicker. Measuring directly a coal's gas content is imperative if this resource is to be profitably developed. This article shows how to measure a coal's gas content by using desorption canisters at the well site.
Recent wells drilled through the buried coals of eastern Kansas show some seams are gassy, permeable, and suitable for economic development of their gas content. The methods utilized to determine a coal seam's gas content are simple and cheap: an airtight canister which can be drained of its gas over time must be at the well site when the bit cuts the coal. Quickly collect and seal a coal sample in this canister, and by the methods explained in this article calculate the volume of gas lost while the coal was cut and taken to the surface. Subsequently, take the canister to the office where gas desorption from the coal continues and record on the data sheets the volumes of gas given off on a regular basis until no more gas emerges. Then remove the coal sample and send it to a laboratory where a Proximate Analysis determines such things as rank, ash content, and exact weight of the coal fraction. With these data in hand, the gas in-place in coal sems under a leasehold is estimated with confidence. If gassy enough, further development of the coal's gas content might be, considered
Some, but not all, of the coals in eastern Kansas are gassy, permeable, and because of their shallow depth warrant development for their gas content. Most operators are unaware of the simple and inexpensive methods to quantify this previously unrecognized gas resource. This article describes the methods of determining a coal's gas content using either cores or drilled chips and identifies some of the pitfalls.
Once geologists and managers are introduced to the simple but effective methods of evaluating gas in coals, an entire new industry will arise, particularly in mature oil and gas fields where gassy coals are behind pipe, requiring little new capital to enhance gas sales.
Coal seams are common in the Middle Pennsylvanian stratigraphic interval in the midcontinent and are easily recognized on certain suites of geophysical logs such as gamma ray and neutron logs. Coal permeability affecting the amount of methane given up by the coal is determined by perforating and testing. However, a coal's methane content remains unknown unless a fresh sample is caught while drilling and desorbed of its gas over time in a sealed canister. This last mentioned requirement is the responsibility of the well-site geologist.
Most prospective coals for coal-bed methane extraction in eastern Kansas are High Volatile A and B in rank. These coals are found in the Middle Pennsylvanian Cherokee Group where they are buried to 900 ft below the surface. These coals generally contain between 200 and 300 ft3 (cf) per ton. This translates to between 360 and 540 thousand of cubic feet per acre foot (Mcf/acre-ft) of coal. Assuming one coal bed 4-ft-thick covers 1 mi2 (which is a common occurrence anywhere in eastern Kansas), then the gas in-place is between 921,600 Mcf and 1,382,400 Mcf per square mile. Current workers in the industry expect that 80% of in-place gas is recoverable over eight to 10 years at rates of 20-120 Mcf gas per day. Brady (1991) estimates 2 billion short tons of coal are buried in eastern Kansas at depths less than 1,500 ft in seams 42 inches thick or thicker. If so, there are between 720 billion and 1.08 trillion cubic feet of gas in-place in eastern Kansas. The greatest coal tonnage (304 million tons) is reported for both the Dawson and Weir seams in Coffey and Montgomery counties, respectively (Brady, 1991). The gas content of the Weir coal seam in Montgomery County is documented to range from 60 cf per ton (which is not of economic interest) up to 350 cf per ton, which is under development. Unfortunately, the gas content of the coals in east-central and northeastern Kansas is mostly unknown due to the lack of desorption work when the coals were drilled. Therefore, a vast resource base is still mostly unknown.
On the must-have-at-the-well-site list is a canister that can be sealed and later drained of gas given up by the coal. Any welder can make a canister by following the diagram shown in fig. 1. Instead of a top with screw-down bolts as shown in fig. 1, aluminum caps with pull-down clamps can be purchased from farm implement stores specializing in irrigation equipment. If all else fails, simply purchase a canister off the shelf from Fields Engineering Services, located in Chatsworth, Georgia.
Figure 1--Diagram of direct method test sample container.

Figure 2--Test sample canister.

The set up shown in fig. 3 must also be at the well site. Use a plastic cylinder marked in cc's and invert it into a pan of water. Without a stand to hold the cylinder in a vertical position and slightly above the bottom of the pan, you might have to hang it from the ceiling.
Figure 3--Equipment used for direct method gas content measurements.

For all of us without a degree in chemistry, the cheap way to get the water into the very top of the cylinder is as follows: Insert a thin plastic tube down into the water and up into the very top of die cylinder. Then suck the water up to the top of the cylinder. Hold your tongue over the end of the tube and firmly pull the tube back out. Eureka, the cylinder is full or nearly full of water.
Next, insert the tube from the canister up into the cylinder as shown in fig. 3. Release the gas slowly from the canister (repeat slowly), allowing bubbles of gas to rise in the cylinder, displacing water downward. Tabulate readings on the form shown in fig. 4. At some time in the future, humbly request your local chemistry department to design a procedure that will not only replace the inverted cylinder, but automatically correct for ambient pressures.
Figure 4--Desorption from tabulation sheet.

Once sealed, it's time to calculate the gas lost while the core or chips were being cut by the bit, brought to the surface, and washed. The formulae and time periods (A to D) are given in fig. 5--just fill in the blanks.
If you have a coal that gives up its gas in a matter of days, you must measure the volume of gas being desorbed in the canister every 2 or 3 minutes for the first one-half hour. If the coal gives up its gas over a period of months, the "lost gas" component won't be large and less-frequent readings will suffice. However, since you won't know how fast the gas will come out of this coal until much later, the only safe approach is to seal the coal into the canister as quickly as possible and take at least five measurements over the next 30 minutes, then relax.
Figure 5--Core sample data sheets and formulae.
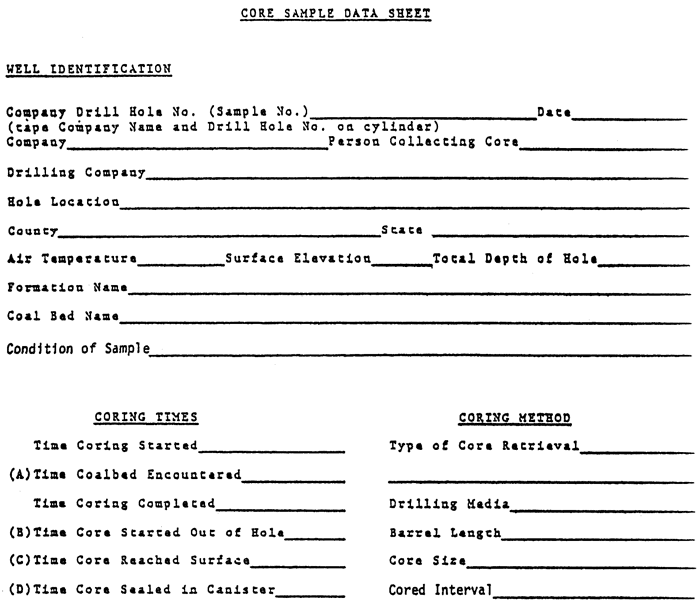
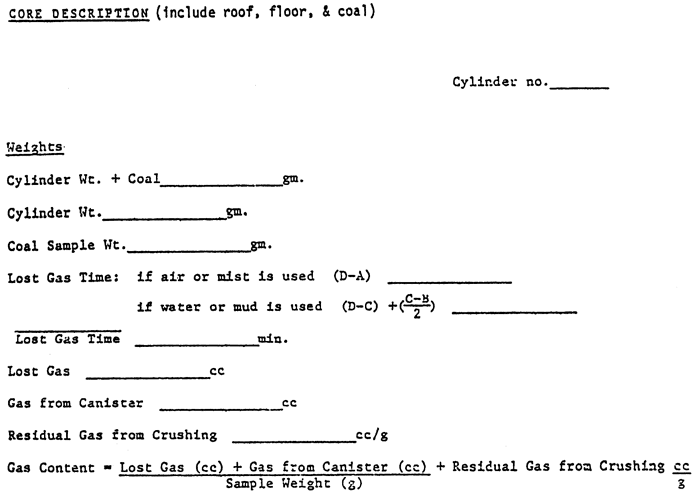
You are now in the perfect position to calculate the "lost gas" component by using the Direct Method (see fig. 6). Or wait until all of the gas is desorbed and use the Smith Williams method, as described in fig. 7. This last mentioned method requires that all the gas be desorbed, which might take months, before the volume of "lost gas" is determined. Most of us are too impatient, so use both methods and confirm the results.
Figure 6--Lost gas determination and example.

Figure 7--Example of Smith Williams method for lost gas determination.
 |
|
Example: Times (see core data sheets): A--11:17 B--12:31 C--13:45 D--13:58 |
| Surface Time Ratio (STR) STR = (D-C) / (D-A) = (13:58 - 13:45) / (13:58 - 11:17) =0.08 |
| Lost Time Ratio (LTR) LTR = D-A / D-a plus (25% of total gas desorbed) = 13:58 - 11:17 / 13:58 - 11:17 + (2 hours and 16 minutes) = 0.54 From chart VCF = 1.40 total gas desorbed (i.e. 12,000 x 1.40 = 16,800 cc 16,800 / weight = cc.gram x 32 = CF/ton |
After the above-mentioned flurry of activity, the remaining steps are achieved at a more leisurely pace.
Try to keep the desorbing room at reservoir temperature. Take only one measurement per day. Slight errors in frequent readings of the graduated cylinder are compounded if the sample is very small (200 grams). As the days pass, less and less gas is desorbed. On some days the canister will actually suck in water (a reverse reading). Continue the desorption process until a week passes without a positive reading. Even then, there is still gas left in the coal; this gas is referred to as residual.
After you are satisfied that no more gas will emerge, the amount of residual gas can be ascertained as described in Diamond and others (1981). Residual gas content is commonly as high as 10% of the total gas measured. Some workers tabulate it. However, since this gas has little or no chance of ever reaching the well bore, it needs to be excluded from the resource base. However, for completeness note that residual gas is not a part of the total gas reported.
Ask the laboratory to perform a "Proximate Analysis" on the coal sample. This entitles you to the following: moisture content, volatile matter, fixed carbon, and BTU. Request the lab to express these values on a dry-ash-free basis (daf). In addition, request specific gravity, sulfur content, and, most importantly, seek to implement the following for the drill chips.
Require the lab to weigh the sample on an "as received" basis and air dried. Next, instruct the lab to place the sample into a fluid with a density of 1.7 gm/cc in order to separate the coal from contaminants. The float (coal) will be expressed as a percentage. Multiply the float percentage by the weight "as-received" to obtain the true weight in grams of the coal chips. The lab should carry out its Proximate Analysis on the float material.
A laboratory located in Chetopa, Kansas, in the heart of coal-country (see references) can perform the analyses described above for about $75 per sample at the current time.
A coal's gas content in CF/ton and Mcf/acre-ft is determined from the following formula:
ft3 (cf) / Ton = [Total Gas Desorbed (include "lost gas") ] / [Dry Weight x (1 - % ash)]
The dry weight of the coal is expressed in grams and its ash content is expressed in percent.
Example: Total Gas = 12,000 cc
Dry Weight = 2,000 grams
Ash content of coal = 8%
cf/ton = 12,000/2,000 x (1 - .08)
= 5.6 cc/grain x 32 to convert to ft3 /ton
= 221 cf/ton (excluding residual gas)
Mcf/acre-ft = cf/ton x 1800
The conversion factor 1800 assumes that the coal has a density of 1.32 gm/cc which is normal for coals in Kansas. If the density is known, the formula to derive this conversion factor is:
Conversion factor = (Coal Density x 62.43 x 43.560) / 2000
Some workers do not correct for ash content. However, the correction is used when comparing coals from different regions.
Finally, the lab should save the float material which can be used later for more sophisticated adsorption measurements undertaken at facilities such as Core Laboratories of Tulsa, Oklahoma; TerraTex of Salt Lake City, Utah; or Raven Ridge Resources of Grand Junction, Colorado. Costs for each adsorption isotherm are in the range of several thousand dollars.
The coals in eastern Kansas are in the High Volatile A-B rank based on their chemistry (empirically measured via the volatile matter) and BTU content. Volatile Matter and BTU value are reported on a dry-ash-free (daf) basis. However, vitrinite reflectance values are reported in the .45 to .55 range, which places the coals in the lower rank of High Volatile C (see fig. 9). This discrepancy is recognized but not understood as of this writing.
Based on documented gas contents ranging between 100 to slightly over 300 cf/ton (residual gas not included) at depths of about 1,000 ft, the coal should be in the High Volatile A rank (figs. 8 and 9).
Figure 8--Estimated maximum producible methane content with depth and rank (Eddy, 1982).

Figure 9--Relationship between rank, depth, and sorptive capacity (After Kim, 1977).

Some eastern Kansas coals were initially condemned for coal-bed methane potential because early workers assumed the low vitrinite reflectance values (and accord-ingly a sub-bituminous rank) meant low methane content. The maximum amount of producible gas in this rank should not be more than 100 cf/ton (fig. 8). Thus the coals were concluded to be of marginal economic value. However, recent work indicates that the rank of eastern Kansas coals are closer to High Volatile A based on the amount of volatile matter and BTU content and these coals usually contain enough gas to be candidates for development. However, the gas content should not be assumed with the risk of insufficient gas upon completion of the well. The gas content should be measured periodically.
If the gas content of the coals in eastern Kansas had not been measured, this resource might still be overlooked. Taking a gas sample at the well site with the simple canister described above may lead to the discovery of a coal-bed methane well.
Figure 10--ASTM coal rank classification.

Cores are the best source of samples for die desorption analysis, but chips are less expensive. Coals desorb their gas according to Fick's law which simply states: "The rate of flow of a substance per unit area is directly proportional to the concentration gradient normal to the direction of flow."
Since the surface area of a hand-full of chips is far greater than a fracture-less lump of coal, the time required for a sample to give up 63% of its gas (sorption time) should be less for drill chips than for cores. Taken to the extreme, a coal reduced to a powder should give up its gas instantaneously.
Recent sampling of the Weir coal of the Cherokee Group from wells drilled in the Sycamore Valley, north of the town of Independence in southeastern Kansas by Stroud Oil Properties shows the following sorption times for the Weir coal of the Cherokee Group at a depth of 950 ft:
| Well Name | Sorption time (63% of gas desorbed) |
|---|---|
| S. Miller #1 | 13 days for a core |
| S. Miller #3 | 1 1/2 days for the chips |
In working with chips, expect the desorption time to be shorter and the "lost gas" percentage to be greater.
Coals in eastern Kansas are frequently gassy enough to warrant development of their gas content, particularly where already behind pipe in mature oil and gas fields. The direct measurement of a coal's gas content is reliably achieved cheaply and easily by utilizing a sealable canister at the well site when the coal is penetrated by the bit. Once sealed in its canister, the gas desorbed from a coal is monitored, resulting in a determination of three components: 1) gas lost before sealing the canister, 2) gas desorbed while in the canister, and 3) residual gas which can only be measured by crushing the coal into a powder. Subsequently, these three components are converted into more commonly used oil field terms such as gas in-place per acre-foot of coal, which permits volumetric evaluations of gas reserves.
Mr. George Jones, President of Stroud Oil Properties of Wichita, Kansas, has allowed the author access to his proprietary data pertaining to the Sycamore Valley coalbed methane program. Stroud Oil Properties is one of the pioneers in producing gas from coal in eastern Kansas and willingly shares information.
Brady, L. L., 1991, Kansas coal resources, production and potential use in the near future; in, Coal Geology of the Interior Coal Province, Western Region, R. B. Finkelman and others, eds.: Environmental and Coal Assoc., Reston, VA, p. 107-127
Close, J. C., and others, 1989, Significance and determination of gas content data as related to coal-bed methane reservoir evaluation and production application: University of Alabama, Tuscaloosa, Proceedings of 1989 Coal-bed Methane Symposium, p. 37-54
Diamond, W. P., and others, 1981, Direct method determination of gas content of coal: procedures and results: U.S. Bureau of Mines, Report of Investigation 8515
Kim, A.G., 1977, Estimating methane content of bituminous coalbeds from adsorption data. US Bureau of Mines Report of Investigations 8245, 22 pp.
Luman, Carrol, 1991, Laboratory for the proximate analysis of coal samples, PO Box 326 Chetopa, KS 67336
Nation, Larry, 1991, SE Kansas becomes methane play ground: American Assoc. of Petroleum Geologists, AAPG Explorer, January, p. 21-22
Rightmire, C. T., 1984, Coal-bed methane resource; in, Coal-bed Methane Resources of the United States: American Assoc. of Petroleum Geologists, Studies in Geology Series, no. 17, p. 9-11
Stoeckinger, W. T., 1989, Coal bed methane production in eastern Kansas, its potential and restraints: American Assoc. of Petroleum Geologists, Mid Continent Section Meeting, Transaction volume, September 24-26, Oklahoma City
Stoeckinger, W. T., 1989, Methane from coal in SE Kansas, the rebirth of an old industry: University of Alabama, Tuscaloosa, Proceedings of 1989 Coal-bed Methane Symposium, p. 211-224
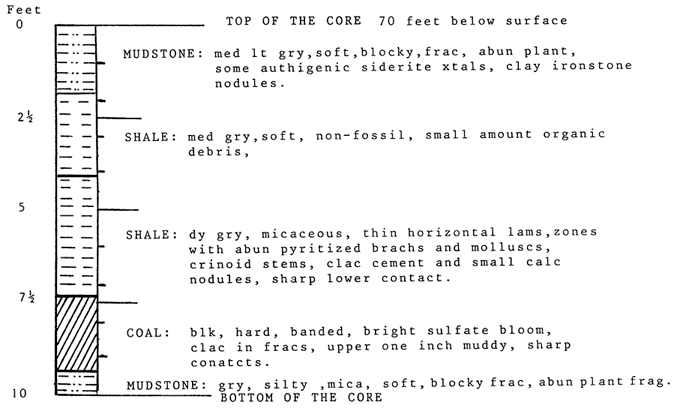
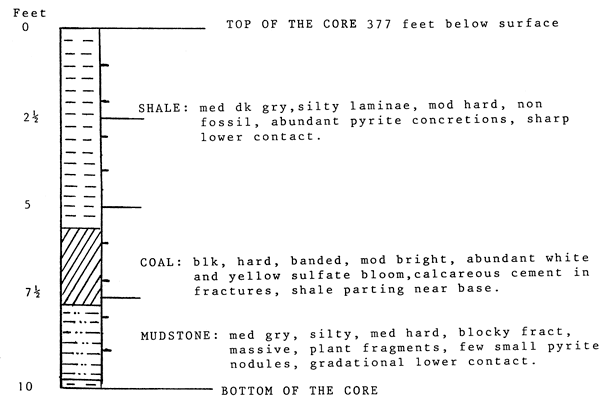
Description of three cores of coals taken in Crawford County, Kansas, and supplied by the Kansas Geological Survey, Lawrence, Kansas.
Core: P & M #5
Box #4
Location: NW NE NW sec. 30, T. 32 S., R. 22 E., Cherokee County, Kansas
Ground Elevation: 830 feet
Described by: Mr. John Harris
Supplied by: Kansas Geological Survey
Contact Person: Larry Brady
General Description: Mineral coal with good fracturing and sharp contacts
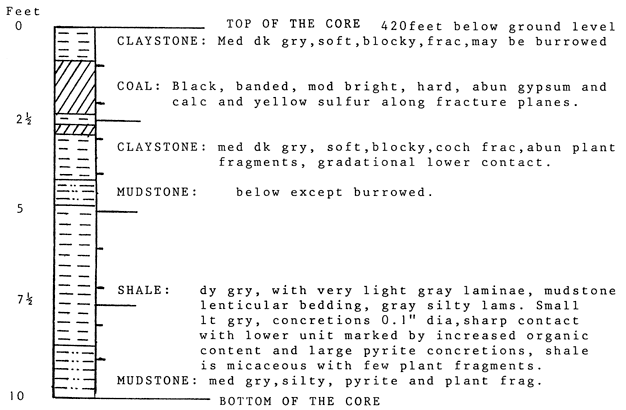
Core: P & M #5
Box #39
Location: NW NE NW sec. 30, T. 32 S., R. 22 E., Cherokee County, Kansas
Ground Elevation: 830 feet
Described by: Mr. John Harris
Supplied by: Kansas Geological Survey
Contact Person: Larry Brady
General Description: Riverton coal with good cleat fracturing coated with both gypsum and calcite
Core: P & M #10
Box #31
Location: NW NW SW sec. 22, T. 31 S. R. 22 E., Cherokee County, Kansas
Ground Elevation: 863 feet
Described by: Mr. John Harris
Supplied by: Kansas Geological Survey
Contact Person: Larry Brady
General Description: 2.2 feet of the Riverton coal showing good cleat fracturing with calcite filling.
Kansas Geological Survey
Comments to webadmin@kgs.ku.edu
Web version created July 5, 2012. Original publication date 1991.
URL=http://www.kgs.ku.edu/PRS/publication/1991/OFR91_52/Stoeckinger/index.html