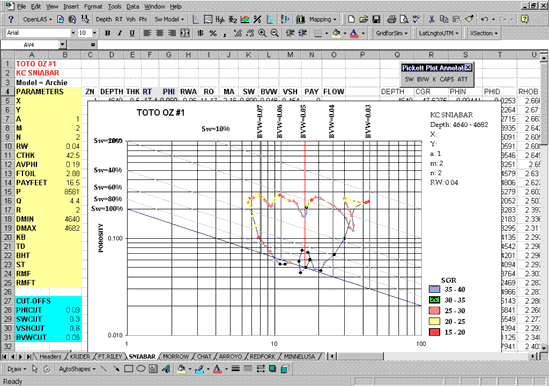

FIGURE 2.13. The "Super Pickett" crossplot is the focal point of the analytical routines and graphical displays are an extension of the standard log-log porosity/resistivity plot. The special features include tracking the pattern of data points by depth, and annotation of the crossplot with bulk volume water and permeability lines in addition to the standard water saturation lines.