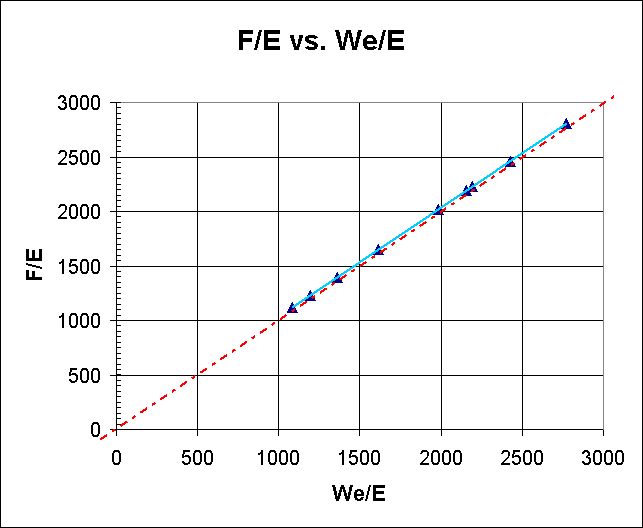
Figure 2.21. Plot of F/E versus We/E for
the "best case" scenario remains a straight line with
unit slope and its intercept within acceptable tolerances.
This page maintained by the Kansas
Geological Survey.
Updated June 1999
Comments to webadmin@kgs.ku.edu
URL=http://www.kgs.ku.edu/PRS/publication/99_22/figure221.html

