Modified from: 1998, Guy, W.J., Byrnes, A.P., Doveton, J.H., and Franseen, E.K., Influence of Lithology and Pore Geometry on NMR Prediction of Permeability and Effective Porosity in Mississippian Carbonates, Kansas: 1998 AAPG Meeting, Salt Lake City, Utah.
Saturated and desaturated NMR response was integrated with air-brine and air-mercury capillary pressure analysis and with lithologic and other petrophysical analyses for cores from a carbonate reservoir in Kansas. This integration provides guidelines for selection of appropriate T2 cutoffs in these rocks and an understanding of lithologic controls on permeability prediction using NMR response. Three cores from the Mississippian reservoir, Schaben Field, Ness County, Kansas were studied (Figure 2.1). From these wells, 50 core plugs, representing a wide range in porosity, permeability, and lithology were selected for detailed investigation. Special core-analysis testing was performed on these samples including (for most samples): routine and in situ porosity and pore volume compressibility, routine air and in situ Klinkenberg permeability, air-brine capillary pressure analysis and determination of "irreducible" brine saturation, air-mercury capillary pressure on selected samples, effective and relative gas permeability, determination of the Archie cementation and saturation exponents, and saturated and desaturated NMR analysis for selected samples. Core lithologies were described and thin-sections of representative samples were examined.
The reservoir at Schaben Field is composed primarily of dolomite or lime mudstone-wackestone, sponge spicule-rich wackestone-packstone, and echinoderm-rich wackestone-packstone-grainstone. Porosity within these lithologies is generally intergranular, intercrystalline, or moldic but may also contain a significant portion of vugs. Grain or crystal sizes are fine to micrite size (<100um to <2um) resulting in very fine pores. Brecciation, fracturing, and carbonate replacement with microporous chert are common in all lithologies. Each lithology exhibits a generally unique range of porosity and permeability values, which together define a continuous porosity-permeability trend. Where fracturing and vugs are present, permeability is enhanced and the range in permeability for any given porosity is broadened. Mercury capillary pressure analysis shows that pore throat size for all lithologies is the dominant control on permeability and threshold entry pressures.
Oil columns in this region are generally less than 50 feet. Water saturations, corresponding to the capillary pressure generated by this column, correlate well with permeability for rocks with little or no vuggy porosity or microporous chert. Because of this correlation, permeability prediction using both porosity and T2 is improved over prediction using porosity alone. While a causal relationship exists between effective porosity (and pore body size), measured by T2, and permeability, the relative influence of effective porosity and pore body sizes appears to be small compared to the influence of pore throats. Based on the significant difference in the correlation between T2 and permeability for rocks with and without vugs, it is probable that this correlation is partially based on a correlation between pore body and pore throat size, which can differ between lithologies exhibiting different pore geometries. If this is correct, accurate permeability prediction using NMR will require "calibration" of the T2-permeability relationship for each lithology exhibiting a unique relationship between pore throats and pore bodies. These correlations and the constant or exponents obtained will therefore be lithology specific. However, relationships using T2 in addition to porosity should also provide a significant improvement over permeability prediction using porosity alone. Where vuggy porosity is present, T2 cutoffs appropriate for intergranular porosity do not provide good permeability prediction. Based on these observations appropriate T2 cutoffs for delineating effective intergranular porosity are range from 10 to 100 and increase with increasing permeability and pore throat and body size.
Many Mississippian reservoirs exhibit high water-cuts and low recovery efficiencies, which requires accurate reservoir characterization and assessment for effective reservoir management. Delineation of effective and ineffective porosity and accurate prediction of production potential plays an important role. Conventional logging tools provide significant data but do not generally allow definitive identification of productive and non-productive intervals. NMR logs provide information concerning effective porosity and pore size, both of which can aid significantly in reservoir characterization, but NMR response has not been evaluated against petrophysical properties in these carbonate reservoir systems. Of particular interest are issues concerning the selection of T2 cutoffs, permeability prediction, and the robustness of selected parameters for the wide range of lithologies present in these reservoirs. As part of the Class 2 project the Schaben field has been extensively studied to provide information for the hundreds of other small operators who manage fields with similar characteristics.
Total Porosity. Routine helium-porosity values, measured on core plugs, range from 4 to 26%. Petrographic analysis indicates that porosity is dominantly intergranular or intercrystalline or moldic where the rock is dolomitized. Locally, subaerial exposure and karstification resulted in the development of fenestral or vuggy porosity. Porosity values are generally highest in the grainstones and lowest in the mudstones. In situ porosity values, measured at a net confining stress of ~2,000 psi (13,800 kPa), are approximately 96+6% of ambient values (error represents 2 standard deviations). NMR total porosity values agreed with helium and gravimetric fluid-filled porosity values within the error of the various measurement methods (+0.1 porosity percent).for 75% of the samples and was off by approximately 1 p.u. for 25% of the samples (Figure 2.4).
"Irreducible Water" Saturation. Air-brine and air-mercury capillary pressure curves indicate that for many of the lithologies present in the Schaben field reservoir there is insufficient oil column to displace water to "irreducible" water saturation levels. Oil columns in the Schaben field range from approximately 35-50ft, corresponding to laboratory air-brine capillary pressures of 15-20 psi and pore entry throat diameters of 2-3 microns. At air-brine capillary pressures of 20 psi, water saturations (Sw20) average 26+5% higher than those near "irreducible" brine saturation, as measured at 1,000 psi air-brine capillary pressure (Figure 2.5). When capillary pressures are insufficient to desaturate a rock to "irreducible" it is important to distinguish between effective porosity as measured by NMR, which represents the volume of the pores involved with total fluid flow, and effective hydrocarbon porosity, which represents the fraction of the effective porosity that is available for hydrocarbon flow. For the carbonates studied here, permeabilities predicted using the effective porosity must be modified to reflect the relative permeability of the actual sample saturations. This requires the development of a correlation between the effective hydrocarbon permeability at the appropriate water saturation and total or absolute permeability.
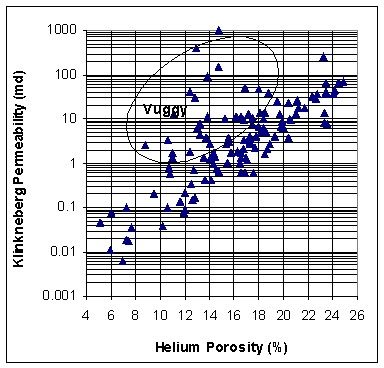
Permeability. Permeability and other petrophysical properties at the core plug scale are generally controlled by matrix grain size and resulting pore throat diameters. Each grain size class (e.g. mudstone, wackestone, packstone, grainstone) exhibits a generally unique range of petrophysical properties modified by the presence of fractures, vuggy porosity, or grain size variations within the lithologic class. Facies comprising multiple lithologies of differing grain size exhibit different properties within those lithologies. Petrophysical properties for facies that are a composite of lithologies are scale-dependent and are a function of the proportions and architecture within the facies. All lithologies exhibit increasing permeability with increasing porosity and can be characterized as lying along the same general porosity-permeability trend (Figure 2.6). Variance in permeability for any given porosity in rocks that are not vuggy is approximately one order of magnitude and may be primarily attributed to the influence of such lithologic variables as the ratio and distribution of matrix and fenestral/vuggy porosity, grain size variations, and subtle mixing or interlamination of lithologies. Vuggy porosity appears to be isolated in mudstones but is better connected in wackestones.
 |
FIGURE 2.6. Cross-plot of permeability versus porosity. |
Principal pore throat diameters, defined as the largest pores that provide access to the majority of the rock porosity as measured by air-mercury capillary pressure analysis, reveal a high degree of correlation between these variables for these rocks (Figure 2.7).
Recognizing that pore throats are a dominant control on permeability, raises the question as to why T2 provides such a good permeability predictor, or improves the prediction of permeability in conjunction with porosity, given that T2 predominantly measures pore body properties. Correlation of the T2 peak position with pore throat diameters, measured by air-mercury capillary pressure, indicates that pore body size is highly correlated with pore throat size (Figure 2.8). The accuracy of the T2-permeabilty correlation may therefore be based on the strong association between pore body and throat sizes. Within lithologies reflecting primarily just grain size change, but still consisting generally of packed spheres, this association could be anticipated to be uniform. This is consistent with the similar T2 exponents for T2-permeability relationships in sandstones. In lithologies exhibiting pore geometries that are not similar to the packed sphere geometry, the relationship between pore bodies and throats must be different. This should be reflected in a change in the T2 exponent in the T2-permeability equation. Figure 2.7 illustrates the difference in correlations between T2 and permeability between pore geometries that are predominantly intergranular and those that are vuggy.
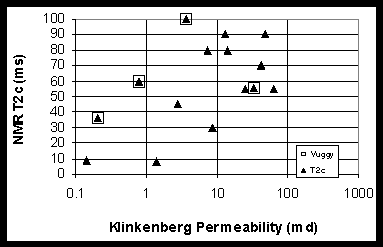
.T2 Cutoff. The relaxation time cutoff for distinguishing between effective and ineffective pore sizes is often reported as 33ms for sandstones and has ranged from 20ms to 225ms for carbonates. For the samples analyzed in this study, to date, cutoff values, defined by the point of divergence of the saturated and desaturated cumulative porosity curves, increase with increasing permeability, and consequently increasing pore body and throat size (Figure 2.9). Rocks with vuggy porosity exhibit significantly greater cutoff values for a given permeability than rocks with intergranular porosity.
 |
FIGURE 2.9. Cross-plot of NMR T2 cutoff and Klinkenberg permeability. |
Saturated and desaturated NMR response was integrated with air-brine and air-mercury capillary pressure analysis and with lithologic and other petrophysical analyses for cores from a carbonate reservoir in Kansas. This integration provides guidelines for selection of appropriate T2 cutoffs in these rocks and an understanding of lithologic controls on permeability prediction using NMR response.
 |
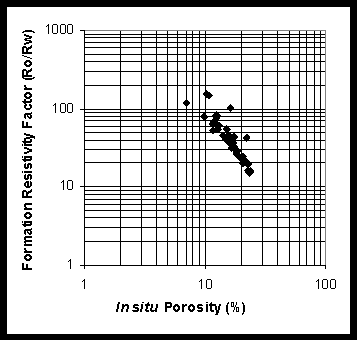
FIGURE 2.10. Cross-plot of in situ formation electrical resistivity factor versus in situ porosity. |
| Next Page | Previous Page | Top of Report |