 |
|
Kansas Geological Survey Open-file Report 2003-82 |
3.5 Discussion
Based on averaged desorbed gas content data from ten wells, estimates of original gas in place (OGIP) can be made for a portion of the Cherokee basin. Since the outcrop belt of the Cherokee Group follows a northeast trend throughout Cherokee and Crawford counties, all volumetric calculations include only coal contained within Chautauqua, Elk, Montgomery, Labette, Wilson, and Neosho counties. An estimate of coal mass for each individual coal must first be determined by using equation 1:
|
Cm = CA-F * T/A-F |
(1) |
where Cm is coal mass (short tons); CA-F is the volume of coal (acre-feet); and T/A-F is tons per acre-foot. In this study a value of 1800 tons per acre-foot for coal, and 2850 tons per acre-foot for shale was applied in the equation. Total coal mass (Cm) for an individual coal is estimated by determining the amount of acre-feet for coal greater than 1.5 feet (0.46 m). Estimates of OGIP are derived using equation 2:
|
OGIP = Gc * Cm |
(2) |
where OGIP is original gas in place (scf); Gc is the average gas
content (scf/ton), on an as received basis; and Cm (short tons)
is the total coal mass. Using the above equation, volumetrics for twelve coals
and two black shales found within the Fort Scott Limestone and Cherokee Group
were determined (Table 3.1).
Unit |
avg.
scf/ton |
acre-feet |
Tons
(short) |
OGIP
(bcf) |
| Little Osage Shale | 6.4 | 13,097,227 | 37,327,097,378 | 239 |
| Summit coal | 22 | 875,520 | 1,575,935,694 | 35 |
| Excello Shale | 24 | 12,080,067 | 34,428,192,005 | 826 |
| Mulky coal | 156 | 511,071 | 919,928,556 | 144 |
| Iron Post coal | 113 | 1,195,535 | 2,151,963,324 | 243 |
| Bevier coal | 115 | 3,137,264 | 5,647,075,056 | 649 |
| Croweburg coal | 85 | 1,271,683 | 2,289,029,292 | 195 |
| Fleming coal | 70 | 878,086 | 1,580,553,918 | 111 |
| Mineral coal | 123 | 2,238,127 | 4,028,628,492 | 496 |
| Scammon coal | 42 | 1,087,171 | 1,956,907,044 | 82 |
| Tebo coal | 70 | 800,868 | 1,441,561,644 | 101 |
| Weir-Pittsburg coal | 190 | 3,028,844 | 5,451,919,740 | 1,036 |
| Aw coal | 116 | 3,832,218 | 6,897,992,742 | 800 |
| Riverton coal | 214 | 4,295,402 | 7,731,723,078 | 1,655 |
| Total OGIP | 6,612 | |||
Table 3.1 – Volumetric calculations for the Fort Scott Limestone shales and Cherokee Group coals (avg. scf/ton is reported on an as received basis).
 |
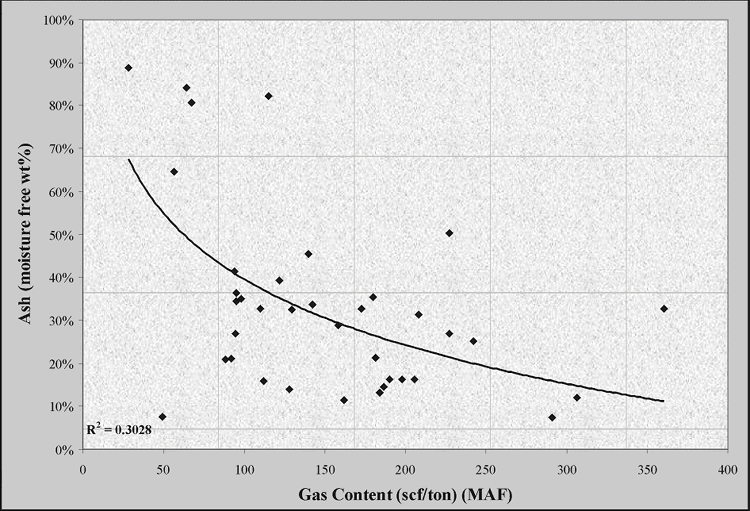
| Figure 3.14 - Gas content conducted on an moisture ash free basis (MAF), plotted as a function of moisture free ash content. Plot shows a general relationship of increasing gas content (MAF) with decreasing ash content (MF). |
 |
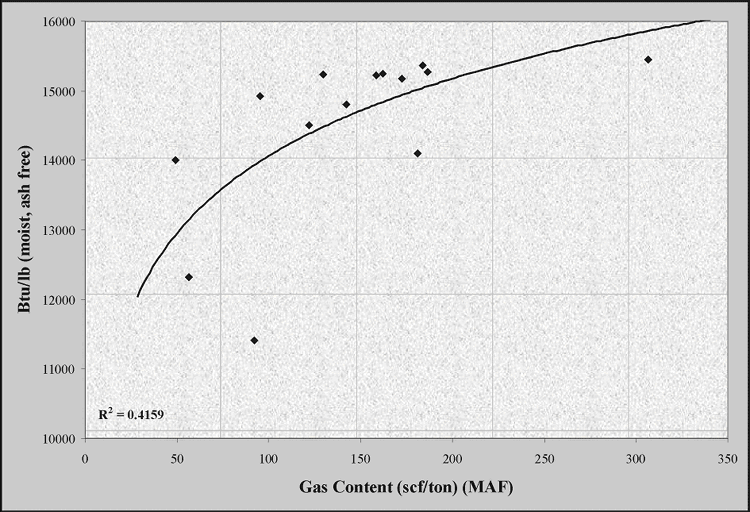
| Figure 3.15 - Gas content conducted on an moist, ash free basis, plotted as a function of Btu/lb (moisture as free). Plot shows a general relationship of increasing gas content (MAF) with increasing Btu/lb (MAF). |
 |
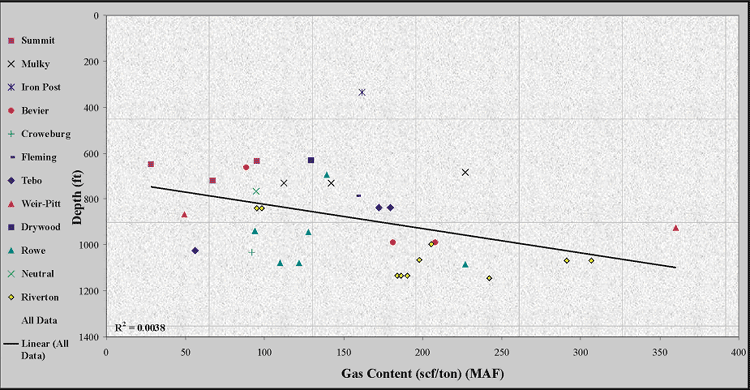
| Figure 3.16 - Gas content conducted on a moisture ash free basis, plotted as a function of depth for coal samples from the Cherokee basin (see Figure 3.02 for sample location and type). Plot shows a relationship of increasing gas content with depth. |
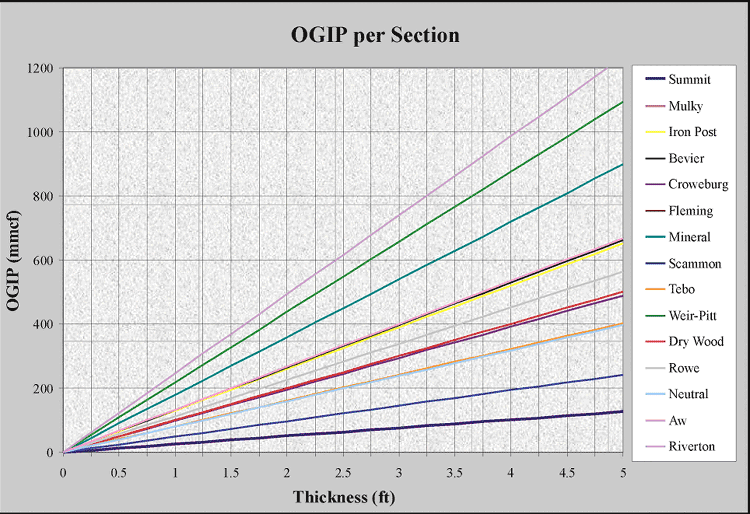
Values for total gas in place for individual coals range from 35 to 1,655 billion cubic feet (bcf). Exploration cutoffs for individual coal seams based on gas content (MAF) versus depth can be made using Figure 3.16. For example, when considering the Riverton coal as an exploration target, gas saturations less than 100 scf/ton (MAF) are found at depths shallower than 800 feet (244 m). If coal is thin (less than 1.5 ft; 0.5 m) it may have insufficient gas content to be a viable exploration target. Figure 3.17 indicates the ranges in gas in place for each coal over an area of one square mile (one section), assuming a constant thickness. Combined coal gas resource estimates for Chautauqua, Elk, Montgomery, Labette, Wilson, and Neosho counties area are more than 6,600 bcf. Several moderately gas-saturated coals such as the Neutral, Rowe and Dry Wood and miscellaneous informally known coals are not included in the above estimate.
 |
| Figure 3.17 - Range of gas in place for each coal per section (one square mile) assuming a constant thickness. |
e-mail : webadmin@kgs.ku.edu
Last updated December 2003
http://www.kgs.ku.edu/PRS/publication/2003/ofr2003-82/chapter3_5.html