Kansas Geological Survey, Open File Report 96-50
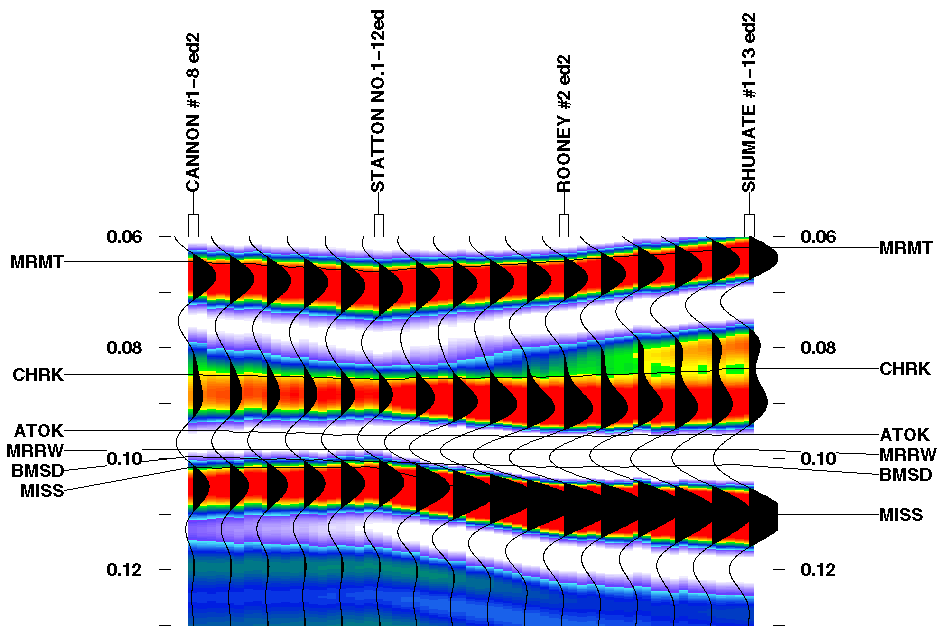
Figure 8a--Multi-well, lower resolution seismic model. Colors represent seismic amplitude. Vertical scale in seconds of two-way travel time from the top of the model. Abbreviations same as Figure 7a. A black and white verion of this plot is available.

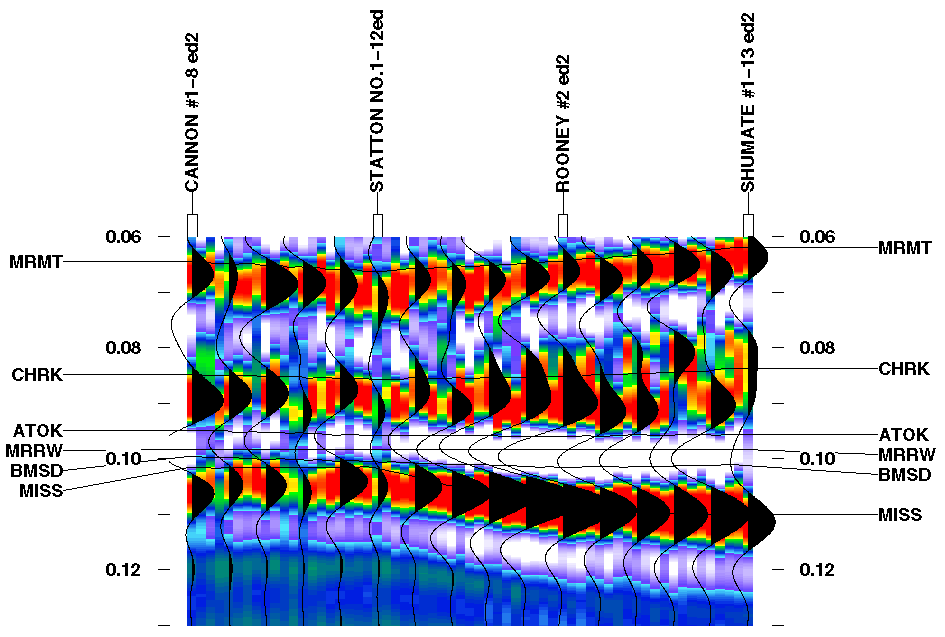
Figure 8b--Same as Figure 8a with random noise added. A black and white verion of this plot is available.

There is no real apparent change in the seismic signature when decreasing the net sandstone thickness by 5 ft. (1.5 m.) between the Statton and Cannon wells. This indicates that the resolution of the wavelet is insufficient to be affected by the decrease in sandstone thickness.
Changing from 8 ft. (2.4 m.) of net upper Morrow sand in the Rooney well to no upper Morrow sand in the Shumate well causes some change in the amplitude of the Mississippian peak and trough above, but it is opposite to that predicted by the single well model. The amplitudes should increase as sandstone thickness decreases. However, a slight increase in the isochron thickness does occur when eliminating the upper Morrow sandstone as predicted in the single well model. One possible explanation for the discrepancy in amplitude variation is tuning thickness. If the interval between the Cherokee and Mississippian reflectors in the Rooney well is at or below the maximum tuning thickness for the bandwidth of the seismic wavelet, then the isochron thickening observed towards the Rooney well would cause a decrease in amplitude of the intervening trough and peaks associated with the Cherokee and Mississippian reflectors. Another complicating factor may be the lower velocity and impedance shale directly beneath the upper Morrow sandstone in the Rooney well when compared to a correlative shale in the Shumate well (Figs. 4a, b and c). This would cause a large acoustic impedance decrease below the sandstone, possibly resulting in the higher amplitude trough in the Rooney well compared to the Shumate well (Fig. 8a).
Although the net sandstone thickness is approximately the same in both the Statton and Rooney wells, the Morrow-Mississippian interval is greater in the Rooney well. This increase in channel thickness results in an increase in amplitude of the Mississippian and Cherokee peaks, as well as an amplitude increase of the trough between them. An isochron increase between the peaks as the channel thickens is also observed. The isochron increase is due to the thickening of channel fill which replaces higher velocity Mississippian limestone with lower velocity clastics (Fig. 7a). The increase in reflection amplitude is probably due to tuning effects which cause constructive interference of reflections as the Cherokee to Mississippian isochron interval increases to maximum tuning thickness near the Rooney well (Fig. 8a).
Addition of 10% random noise to this model makes interpretation of anything but Morrow channel thickening almost impossible (Fig. 8b). The isochron increase associated with the thickening is obvious, as well as the increase in amplitude of the Mississippian peak and trough above it as the channel gets thicker. The slight decrease in amplitude of the Mississippian peak and trough above it between the Rooney and Shumate wells is also still visible on the seismic section.